
NPR put together a nice graphic showing the most common job in every state every two years from 1978 to 2014. It’s a fascinating ride from secretaries, farmers, and machine operators to truck drivers, truck drivers, and truck drivers. Click to enlarge.
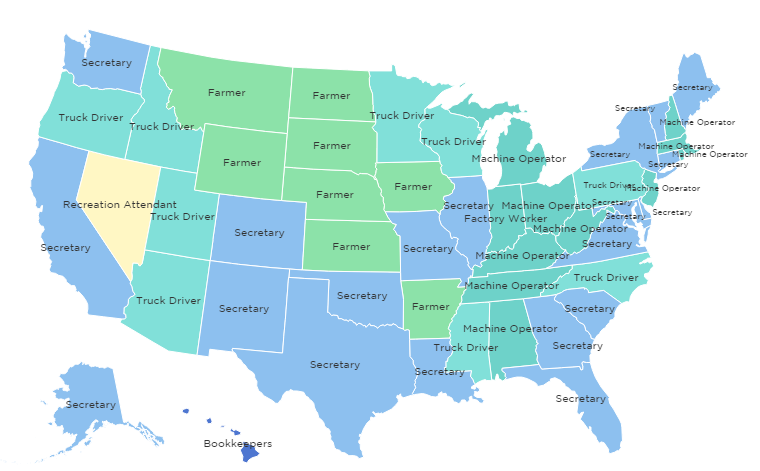
2014: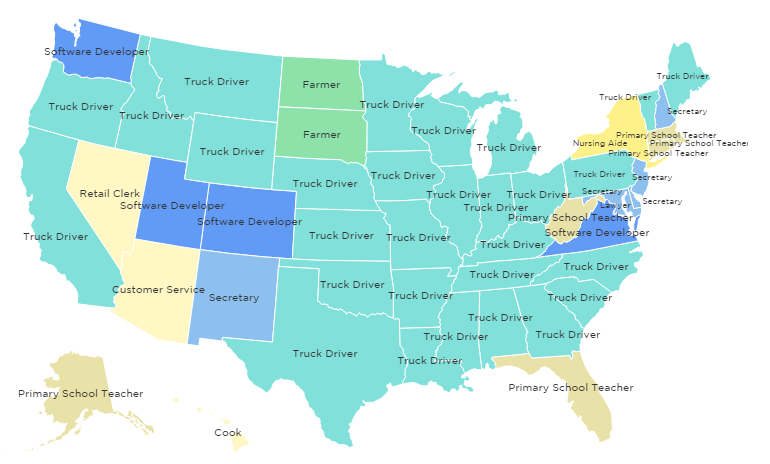
Quoctrung Bui explains some of the trends:
- Truck drivers came to “dominate the map” partly because the job can’t be outsources or automated (yet).
- Much of the work of secretaries was replaced by computers.
- Manufacturing jobs have been sent overseas (but you knew that).
- And advances in farming technology means that we can grow more and more food with fewer and fewer people.
He also points out — with a “heh” — that the most common job in Washington D.C. is lawyer. But he didn’t mention that in 1996 it was janitors. There’s gotta be a politician joke in there, too.
![]()
Here are some of the changes I found interesting, with mostly uninformed commentary. The three boxes represent 1978, 1996, and 2014.
Methinks reality television is not telling me the truth about Alaska.
![]()
Well, we know what Nevada‘s for. Except I guess people used to go there to do stuff and now they just go there to buy stuff.![]()
South Dakota and North Dakota, holding strong. New York, the only state on the list that’s top job is nursing. Take that, Florida!
![]()
Comments 19
The Most Common Job in Every State, 1978-2014 - Treat Them Better — March 5, 2015
[…] The Most Common Job in Every State, 1978-2014 […]
Bill R — March 5, 2015
Oh yes, tired but true, everything in American is going to hell in a hand basket on this board. Its got to be one of the worst places to live, unless you consider other places on the planet earth. (Paraphrasing Churchill here.)
FWIW, trucking has become an amazingly green technology, putting more stuff at our doorsteps than every before without us having to drive all over individually to get it (think logistics).
In any event, readers must wonder why there is hardly ever a positive comment about America or American society in general on this board. When read in the collective the picture is one of distrust and even hatred of who we are.
I am proud to defend your right to criticize, but I wonder why you choose to stay here.
MJ — March 5, 2015
How well can our current transportation infrastructure handle all of these trucks? Several times a week, I do "non-rush hour" 20-40 minute trips (15- 26 miles) on 2 major Illinois interstates outside of Chicago.
The amount of trucks that are in the left lane or center-left lane on a 4-lane road is obscene. I have to be extra vigilant about not getting boxed in by trucks. My fuel efficient car is not tiny but could easily be crushed.
But these guys have to make their deliveries on time. I know that I haven't always been the best driver. I hope I've never given any of those truckers a heart attack in my early driving days.
Larry Charles Wilson — March 5, 2015
I remember when one of the local community colleges decided that instead of increasing faculty pay they would make the Instructors "Professors." This supposedly made the faculty members feel better about themselves.
It was during the mid- to late-1990s that Secretaries were renamed Administrative Assistants...also without a rise in salary. Of course this change in nomenclature was far more widespread than simply the colleges.
I was asleep when clerks became Sales Associates.
The average homo sapiens sapiens isn't.
The NH Secretary. | I'm Just a Secretary — March 6, 2015
[…] http://thesocietypages.org/socimages/2015/03/05/the-most-common-job-in-every-state-1978-2014/ […]
OkinKun — March 6, 2015
So what's going to happen in 5-10 years, when a significant amount of Trucks will become automated/self-driving?
If it's the most common job in the country.. We're going to see a TON of people becoming unemployed, with no other skills. And there's no way they can all be put back through education/training, far too many of them. Mark my words, there is NO WAY the government will protect workers in these situations. Once the vehicles prove themselves to be safe and reliable, companies will refuse to pay workers just to sit behind the wheel.
Hopefully people will be forced to stop calling the unemployed names like "parasite".. That's never been true anyway, just something the greedy use to justify being greedy.
[Repost] The Most Common Job In Every State In 2014: Truck driver, Truck Driver, Truck Driver.. | Reddit Spy — March 7, 2015
[…] by Stark_Warg [link] […]
Rockwell — September 8, 2018
I think this can also be affected by the fact that the younger generation absolutely doesn't want to work on the field and wants to receive a fairly good salary. If you are a driver, you get a good salary and you can see the world while riding around, what else is needed? I also once thought about this work. But then I found my dream office job and decided to stay. In many respects, it was a merit of https://top5resumewriting.services/resumeprofessionalwriters-com-review/ because it was their resume that helped me to get it.
martin garix — January 25, 2019
https://google.com
El Miedo a la Automatización y El Rol de la Mujer Hecha Como Objeto – TRANS – CIS – THOR — August 26, 2019
[…] Empleo En Estados Unidos – Wade, L. (2015). The Most Common Job in each state 1978 – 2014. En Sociological Images. Recuperado de https://thesocietypages.org/socimages/2015/03/05/the-most-common-job-in-every-state-1978-2014/ […]
BrueveTat — June 1, 2022
I'd like to join here. Does anyone know detailed information about TTT token? I started to get interested in token from TabTrader. Then I accidentally found this source https://tabtrader.com/blog/tab-trader-partners-with-solminter. The TabTrader team is now collaborating with Solminter. This token is based on Solana blockchain. I think it will be also relevant to you.
Nico Rocky — December 5, 2022
I'm not very good at looking for information on the Internet. Maybe some of you can recommend a reliable site to find a good job for a man?
Emory Scott — December 5, 2022
Hi. Do you have any skills or experience? If you understand electrical work, I would recommend you to look for jobs in this field because it is very lucrative. Good electricians are very highly valued. I've found a lot of Electrician Job listings here on https://jobssite.ca/jobs/electrician/ . I'm sure that some of these positions might be right for you.
Hanna — February 7, 2023
Finding the right specialist for a responsible position may take longer than you planned. With the help of the Retained Searches https://www.paragonalpha.com/services service, we will select the best candidate for you.
Oscar82 — October 30, 2023
In our opinion, Belong simplifies the world of NFT tickets by making it convenient and hassle-free. With their app, you can conveniently scan QR codes, make purchases with credit cards, and check in easily. You can also connect with other event attendees, stay up to date with event information, and enjoy exclusive access. The Belong platform provides a seamless nft concert tickets process, ensuring a hassle-free and enjoyable event experience. The future is at your fingertips with Belong, making NFT ticketing more accessible and convenient than ever!