
Dmitriy T.M. sent in a link to an article by David Leonhardt in the New York Times about differences in income between various religious groups in the U.S. This graph shows the percent of households earning more than $75,000 a year (the numbers along the side; and note that, somewhat counterintuitively, the shade of each color gets lighter as the percentage gets higher), as well as the percent of each group with a college degree (along the top). In order from least to most educated, we have Jehovah’s Witnesses, Pentecostals, the unaffiliated, Baptists, Muslims, Catholics, Mormons, Lutherans, Methodists, Presbyterians, those who identify as secular, Orthodox Christians, Buddhists, Unitarians, Episcopalians, Conservative Jews, Reform Jews, and Hindus. Not surprisingly, income is pretty strongly correlated with education:
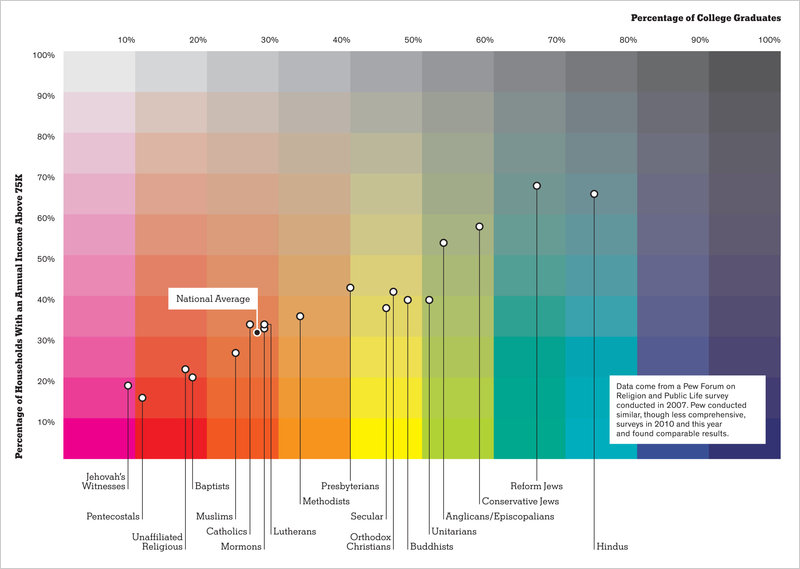
The data come from a 2007 Pew Forum on Religion and Public Life survey (which we’ve posted on before), though the NYT reports that they did smaller surveys in 2010 and 2011 and found similar patterns.
Also see our posts on the demographics of the non-religious and religion, income, and 2008 Presidential voting behavior.
Comments 17
Philip Cohen — May 15, 2011
Thanks. You get similar results when you line up lots of groups according to their average levels of education -- and then see who is not on the line for a story about sources of difference. (Unfortunately, the color doesn't add any information. Besides making it more pleasing to look at, it just makes a simple graph appear less simple, mystifying "infographic" construction.)
gasstationwithoutpumps — May 15, 2011
The graphic shows a high correlation between education and income (no news there), and between both and religious affiliation. This is also not surprising, though some of the specific groups doing well in the US is surprising. For example, Hindus are probably doing well because of immigration policies which only allow extremely well-educated immigrants from India. Catholics are doing poorly on average because of huge immigration of very poor farm workers. I suspect that the correlation of education and income is stronger than this graph suggests, as some of the points here are averages of pretty large clouds.
Laura — May 15, 2011
I would like to see where atheists fit on this chart!
MC — May 15, 2011
Atheists are likely included in the "secular" category-it makes sense that way.
SteelBlaidd — May 15, 2011
Income and education are to tightly correlated to make this an interesting graph what would be interesting would be to see income or education compared with activity level.
Jawnita — May 15, 2011
There's a similar chart, comparing religion and writing proficiency, near the bottom of this post at the OKTrends blog (where the staff of OKCupid, a strongly algorithm-based online dating site, post pretty charts and graphs from their data): http://blog.okcupid.com/index.php/the-real-stuff-white-people-like/
Jcoop — May 15, 2011
The interesting aspect is the "religious" correlation. I am no world religions scholar but from casual observation have found that Jehovah Witnesses generally "home-school", as do various extreme christian sects, with an emphasis on biblical teachings. On the other end of the spectrum, general knowledge, learning, accrual of wisdom, and education are all deeply ingrained values within the Hindu and Jewish religious doctrines.
Early indoctrination scores once again.
Gexx — May 15, 2011
A very interesting graph. It made me wonder what sorts of distribution we would see with either college degrees or annual income depending on the age that people 'became' religious. You know, people who have always been x versus people who started following in in high school versus college versus later versus much later.
politica — May 16, 2011
Many Jehovah's are black, accounting for the low income.
Welcome to Church! How Much Money Do You Make? « Pure Artsy Capitalism — May 16, 2011
[...] to Sociological Images, I came across this interesting little chart [...]
Income and Religion/Choosing a Mate « Welcome to the Doctor's Office — May 16, 2011
[...] Income and Educational Differences in U.S. Religious Groups [...]
Isaac — June 27, 2016
I'd like to offer an explanation if I may. I think that a core explanation has to do with a religious person's interpretation of what is the deity's responsibility and what is their responsibility as a human. On the lower end, those religions are dominated by a belief that basically states that to please their God, they just have to have faith and believe, and that if God wanted them to be a certain way, he would make them that way - not through their own effort but by God's divine will. It's the "I'm saved by faith not by works", and the "I'm laying up my treasures in heaven" people. It's a lottery mentality. It removes the human from the equation, and puts all of the potential for results on to the deity. On the higher end, those religions emphasize the need to do certain things that will please God. They emphasize needing to do good works, adherence to laws, etc. which if they don't do them, will put them on the outs with God. Their incentive is to work, to act, to do, not just to have blind faith. The results also have to do with what the religion thinks about money - is it virtuous to be poor, or is it more virtuous to be rich and those blessings come through activity that you can control, not blindly from God, which is something that you can't control.