
Guest Post by University of Minnesota graduate student and friend of the blog, Ryan Larson. See the more lovely pdf version here.
When reading my esteemed colleague (and former official, and current satellite-unofficial, advisor) Andrew Lindner’s post on the shift in buying power in English Premier League teams, my interest was sparked by one of his last propositions: “It may just turn out that 2015/16 was an outlier season and that the clubs with the deep pockets will buy their way to success again next season.” In order to adequately evaluate this claim, data from the coming seasons would be needed. However, we can assess whether the 2015-2016 break in the “buying wins” trend is due to a few influential points. In other words, do a small number of teams disproportionately account for the change in trend?
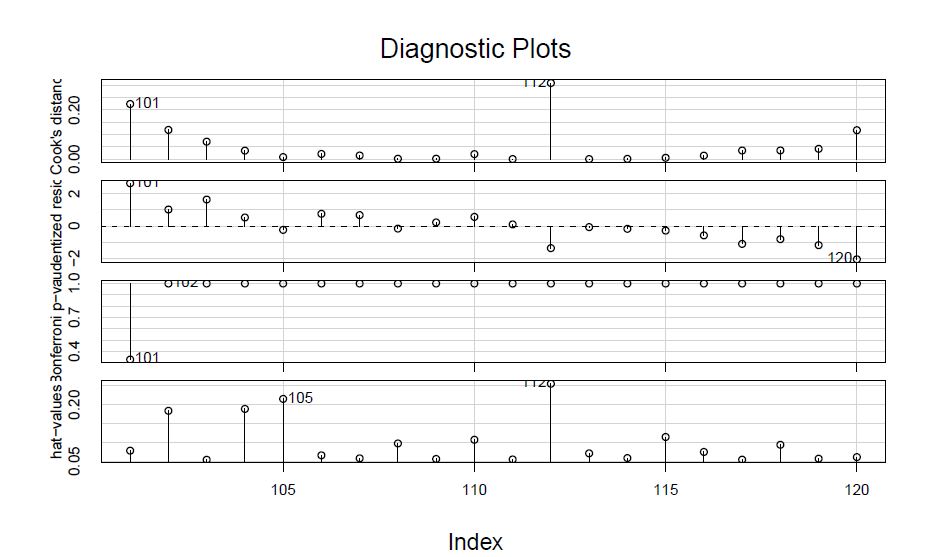
After replicating Andrew’s data manipulation and models, I looked at some influence regression diagnostics, namely Cook’s Distance. In a nutshell, Cook’s Distance measures the change in a regression coefficient when an observation is deleted. The following plot shows influence indicies for each point in the 2015-2016 model, and indicates that points 101 and 112 are statistically influential: Leicester City and Chelsea.
In accordance with the high Cook’s Distance values, I removed Leicester City and Chelsea from the 2015/2016 model. Although the downturn of money-flush Chelsea and the success of relatively pauperized Leicester City are influential, they in themselves do not account for the break in the trend. In terms of the trend Andrew is noting, the correlation between wage bill and points in the 2010/2011-2014/2015 seasons is .81, and the correlation (with estimated points) in the current 2015/2016 season is .43 – indeed a marked difference. But even after removing Leicester City and Chelsea, the correlation in the current season is .64. In other words, wage bill is still giving teams less point return as compared to previous seasons, even after the removal of Chelsea and Leicester City (see updated plot below). This strengthens the assertion that the diminishing power of deep pockets is an overall trend (at least for this season) as opposed to just the disproportionate influence of two wildly performing teams respective to their piggybanks.

Comments 24
Emmanuel — March 27, 2025
I have wondering for a while, but finally I found a well manages website to download switch roms and play games on my Nintendo switch emulator like yuzu.
Mukesh — March 27, 2025
What's more amazing is that now you can download Tekken 3 APK and play it on your android devices for free.
Cassian — May 10, 2025
Fascinating analysis—especially the use of Cook’s Distance to isolate Leicester and Chelsea's influence. It’s intriguing to consider how data like this might shape future models for competitive balance. I’ve been exploring similar concepts around digital behavior trends over at teraboxsmodapk.com
and found this perspective really insightful.
Henry — May 10, 2025
This post raises an important point about statistical outliers like Leicester’s 2015/16 season. It's fascinating to see data-backed evidence suggesting a broader shift in the EPL’s financial dynamics. Similar patterns of unpredictability show up in other competitive systems too—something I've seen when analyzing trends at carxstreetsmodapk.com
. Great read!
Cassian — May 10, 2025
Fascinating analysis—especially the use of Cook’s Distance to isolate Leicester and Chelsea’s impact. It’s a great reminder that statistical outliers can’t fully explain broader shifts in correlation trends. I’ve seen similar surprises in user behavior data over atFascinating analysis—especially the use of Cook’s Distance to isolate Leicester and Chelsea’s impact. It’s a great reminder that statistical outliers can’t fully explain broader shifts in correlation trends. I’ve seen similar surprises in user behavior data over at Fascinating analysis—especially the use of Cook’s Distance to isolate Leicester and Chelsea’s impact. It’s a great reminder that statistical outliers can’t fully explain broader shifts in correlation trends. I’ve seen similar surprises in user behavior data over at bitlifeapkmods.com
, where expected predictors sometimes defy logic., where expected predictors sometimes defy logic. where expected predictors sometimes defy logic.
Jahmir — May 10, 2025
Fascinating analysis—especially how Cook’s Distance reveals Leicester and Chelsea's outsized impact yet doesn't fully explain the broader trend. It’s intriguing to see how data can uncover deeper shifts in football dynamics, much like how unexpected strategies can change outcomes in games like those discussed on 3pattiblues.com
.
Gold Client — May 25, 2025
Fascinating breakdown of how the Blues and Foxes have influenced strategic gameplay! It’s intriguing how their styles parallel decision-making in competitive environments. I’ve explored similar risk-reward dynamics in games at 3patticrown.me — the crossover insights are eye-opening.
MaAdi — August 11, 2025
Great breakdown of how regression diagnostics like Cook’s Distance reveal the outsized impact of Leicester City and Chelsea in shifting the wage-bill vs. points relationship. It’s fascinating to see how complex systems can defy expectations. On a related note, for anyone managing large datasets or transferring analysis files securely and efficiently, I highly recommend trying the TeraBox Uploader (https://ultraterabox.com/)—it’s a seamless, hardware-free alternative that complements deep analytical work
Mark Pousee — August 29, 2025
If you want premium features, you can order stainless steel Stanley Cups in Pakistan that are rust-resistant, dishwasher-safe, and built for outdoor durability. These models are perfect for travel, gym, and camping, ensuring performance even in rugged conditions.
william jhone — October 26, 2025
Really enjoyed this reflection on the cultural influence of the blues and its connection to modern music. It’s fascinating how art, identity, and history shape creative expression across borders. For anyone interested in exploring how culture and systems intertwine in other countries, Nif Portugal provides insight into the administrative and social frameworks of Portugal, including how tax identification works within its national structure.
Edward J. French — October 29, 2025
For premium quality, you can get stainless steel Stanley Cups in Pakistan that are rust-resistant, dishwasher-safe, and built for lasting outdoor durability. Ideal for travel, workouts, and camping, these models deliver reliable performance even in tough conditions.
Fútbol Libre TV
Iman — November 8, 2025
Really interesting perspective! The connection between cultural expression and social influence is so deep — especially how music styles like the blues can shape identity and emotion across generations. Loved reading this!
bilal jack — December 6, 2025
The Influence of the Blues and Foxes is a fascinating topic that explores how these music and cultural icons have shaped entertainment and society. You can dive deeper and enjoy related content easily to the using codigo vip YouCine.for more visite this:https://baixaryoucine.com
Sophia — March 12, 2026
The influence of the Blues can be seen in many modern music styles through its emotional lyrics, expressive guitar techniques, and rhythmic patterns. Artists often draw inspiration from blues to create deeper storytelling and soulful sounds. Its impact also spreads through culture and entertainment, shaping how music evolves over time. Just like creative music evolves with technology, image tools like Remini Pro APK help enhance visuals using advanced AI features.
Albert Recardo — March 28, 2026
The influence of the Blues and Foxes reflects a deep impact on culture, music, and storytelling, where emotion, rhythm, and identity all come together in a unique way. These elements shape how narratives are shared and experienced, making them more engaging and memorable. Just like how structured standards help organize information clearly, exploring different forms of content—from cultural topics to gaming—can offer something for everyone, whether you're diving into ideas or discovering Nintendo Switch ROMs games on WinROMs.com
Get Roms — April 4, 2026
Switch Roms WII ROM.COM is where you can find and download for free over 10,000 original and updated game ROM files for the Nintendo Switch.
nsproms — May 15, 2026
Switch ROMs
Appstorrent — May 16, 2026
Appstorrent is a trusted platform for discovering the latest apps, useful software, and trending games. Explore easy guides, tech updates, and powerful digital tools all in one place. Stay updated with new releases and find the best applications for your daily needs.
Appstorrent — May 16, 2026
Great Article Really I appreciate your work!
Jemmy — May 16, 2026
Discover the latest apps, useful software, and trending games with easy guides and tech updates all in one place. Stay updated with new releases and find the best digital tools for your daily needs —* Appstorrent *
Winroms — June 12, 2026
If you're looking for the latest games, ROMs, emulators, software downloads, and tech updates, click here WinROMs and discover everything in one place.
RomsGames — June 17, 2026
If you're looking for the latest Nintendo Switch ROMs (link), be sure to check out RomsGames (https://roms-games.com/). The platform offers a comprehensive collection of Nintendo Switch games in NSP and XCI formats, compatible with Yuzu and Ryujinx emulators as well as modded Nintendo Switch consoles. Whether you're exploring new releases or revisiting classic titles, RomsGames provides a wide range of gaming content for enthusiasts.
Switch ROM — June 20, 2026
If anyone is looking for the latest Switch ROMs, be sure to visit here! https://switch-rom.me