Half a century ago, President Lyndon Johnson launched America’s War on Poverty; yet by the 1980s President Ronald Reagan famously declared that “we waged a war on poverty and poverty won.” To back up this claim, conservatives point to official U.S. statistics showing that the percentage of Americans living in poverty, around 15%, has changed very little over the decades.
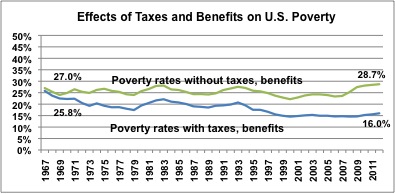
But the official poverty measure is outdated – so I teamed up with several colleagues to produce estimates using a more accurate one. When we use the improved measure, it turns out that U.S. social programs and taxes have had a powerful effect on reducing poverty since the mid-1960s. Back then, government programs did little to alleviate poverty, but today public programs and taxes cut the percentage of people living in poverty by almost half, from the 28.7% it would be without government efforts to 16% after public programs are included. Far too many Americans continue to have inadequate incomes, but U.S. policies have helped millions avoid poverty.
The Need for a More Comprehensive Poverty Measure
America’s longstanding official poverty measure is outdated, because it is not adjusted appropriately for the needs of different types of individuals and households and it fails to take into account the full range of income and expenses that individuals and households face. In particular, it does not calculate the income effects of the full range of government programs whose aim it is to reduce poverty in the United States. Because of these and other failings, researchers cannot simply track official poverty measurements if they want an accurate picture of trends in poverty or the role of government policies in alleviating it.
Along with Liana Fox, Irv Garfinkel, Neeraj Kaushal, and Christopher Wimer, I re-analyzed trends in poverty using an improved measure – called the supplemental poverty measure – that includes near-cash benefits, in-kind benefits, and tax credits that go to various individuals and families. This supplemental measure also adjusts income calculations for taxes paid and for unavoidable child care, work-related, and medical expenses.Since 2009, the U.S. Census Bureau has estimated annual poverty levels using both the traditional and the supplemental poverty measure, but it has not estimated historical trends using the revised measure. My colleagues and I have taken this extra step, estimating trends in poverty since 1967 using two new measures, one similar to the supplemental poverty measure in which the poverty threshold is calculated for each year using contemporary living standards, and another using an “anchored supplemental poverty” measure, in which we take today’s supplemental threshold and carry it back historically. The second approach is the one we use here in this brief. Data on incomes over the years come from the Annual Social and Economic Supplement to the Current Population Survey.
When we use the supplemental poverty measure to track the percentages of Americans under the poverty line, a different picture emerges. The traditional poverty measure says that 14% were poor in 1967 and 15% in 2012, but the anchored supplemental measure shows the percentage living in poverty falling by more than 40%.
A New Perspective on U.S. Anti-Poverty Efforts
Our estimates also provide new insights as to the role of government programs. Using the supplemental measure anchored to 2012, we tracked the percentages of the U.S. population that would have been in poverty with and without including income from taxes and government social benefits. The green line shows poverty without taxes and benefits, and the blue line shows how much poverty has been reduced by taxes and social benefits.
Government benefits include food and nutrition programs such as Food Stamps, school lunches, and programs for pregnant women and infants; cash welfare benefits of various kinds; housing subsidies; and Social Security, unemployment benefits, workers’ compensation, and public pensions. Taxes include both those that reduce income (payroll taxes, federal and state income taxes) and those that boost incomes (like the Earned Income Tax Credit and other tax credits). Clearly, U.S. taxes and benefit programs have greatly reduced the percentage of Americans living below the poverty line. If we only counted incomes and expenses in the private market, poverty would have increased slightly over the past half century. But when taxes and social benefits are included, poverty sharply declines.These results underline a key point: if we want to properly assess the progress the United States has made in fighting poverty, we must include all income and expenses. Properly measured, poverty has fallen substantially since the War on Poverty was declared. The war is far from over, but hard-won ground has been gained – and millions of Americans would suffer if anti-poverty efforts cease now or suffer major reverses.
For another SSN brief from Jane Waldfogel, check out Fifty Years After the War on Poverty, the Safety Net for America’s Families with Children is Frayed.
—
Read more in Christopher Wimer, Liana Fox, Irv Garfinkel, Neeraj Kaushal, and Jane Waldfogel, “Trends in Poverty with an Anchored Supplemental Poverty Measure,” CPRC Working Paper 13-01, 2013 and Liana Fox et al., “Waging War on Poverty: Historical Trends in Poverty Using the Supplemental Poverty Measure,” CPRC Working Paper 13-02, 2013.


 Research to Improve Policy: The Scholars Strategy Network seeks to improve public policy and strengthen democracy by organizing scholars working in America's colleges and universities. SSN's founding director is Theda Skocpol, Victor S. Thomas Professor of Government and Sociology at Harvard University.