
 –
–
Happy Graduation, Seniors! Congratulations! What’s next? Below is some sociologically-inspired, out-of-the-box advice on work, love, family, friendship, and the meaning of life. For new grads from the two of us!
1. Don’t Worry About Making Your Dreams Come True
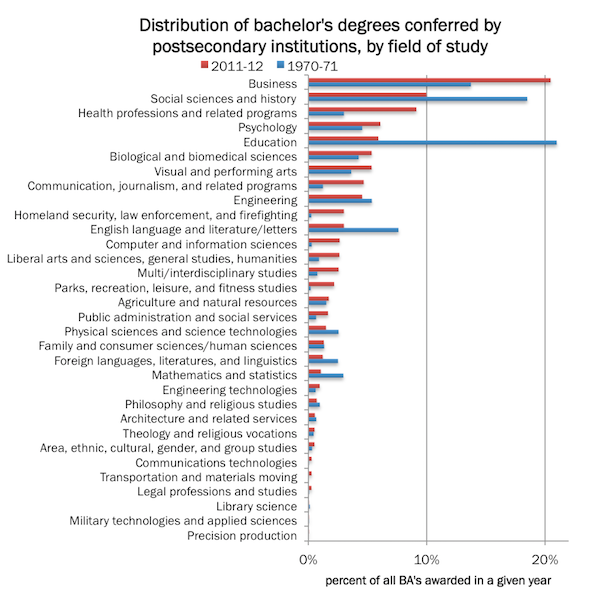
College graduates are often told: “follow your passion,” do “what you love,” what you were “meant to do,” or “make your dreams come true.” Two-thirds think they’re going find a job that allows them to change the world, half within five years. Yikes.
This sets young people up to fail. The truth is that the vast majority of us will not be employed in a job that is both our lifelong passion and a world-changer; that’s just not the way our global economy is. So it’s ok to set your sights just a tad below occupational ecstasy. Just find a job that you like. Use that job to help you have a full life with lots of good things and pleasure and helping others and stuff. A great life is pretty good, even if it’s not perfect.
2. Make Friends
Americans put a lot of emphasis on finding Mr. or Ms. Right and getting married. We think this will bring us happiness. In fact, however, both psychological well-being and health are more strongly related to friendship. If you have good friends, you’ll be less likely to get the common cold, less likely to die from cancer, recover better from the loss of a spouse, and keep your mental acuity as you age. You’ll also feel more capable of facing life’s challenges, be less likely to feed depressed or commit suicide, and be happier in old age. Having happy friends increases your chance of being happy as much as an extra $145,500 a year does. So, make friends!
3. Don’t Worry about Being Single
Single people, especially women, are stigmatized in our society: we’re all familiar with the image of a sad, lonely woman eating ice cream with her cats in her pajamas on Saturday night. But about 45% of U.S. adults aren’t married and around 1 in 7 lives alone.
This might be you. Research shows that young people’s expectations about their marital status (e.g., the desire to be married by 30 and have kids by 32) have little or no relationship to what actually happens to people. So, go with the flow.
And, if you’re single, you’re in good company. Single people spend more time with friends, volunteer more, and are more involved in their communities than married people. Never-married and divorced women are happier, on average, than married women. So, don’t buy into the myth of the miserable singleton.
4. Don’t Take Your Ideas about Gender and Marriage Too Seriously
If you do get married, be both principled and flexible. Relationship satisfaction, financial security, and happy kids are more strongly related to the ability to adapt in the face of life’s challenges than any particular way of organizing families. The most functional families are ones that can bend. So partnering with someone who thinks that one partner should support their families and the other should take responsibility for the house and children is a recipe for disaster. So is being equally rigid about non-traditional divisions of labor. It’s okay to have ideas about how to organize your family – and, for the love of god, please talk about both your ideals and fallback positions on this – but your best bet for happiness is to be flexible.
5. Think Hard About Whether to Buy a House
Our current image of the American Dream revolves around homeownership, and buying a home is often taken for granted as a stage on the path to full-fledge adulthood. But the ideal of universal home ownership was born in the 1950s. It’s a rather new idea.
With such a short history, it’s funny that people often insist that buying a house is a fool-proof investment and the best way to secure retirement. In fact, buying a house may not be the best choice for you. The mortgage may be less than rent, but there are also taxes, insurance, and the increasingly common Home Owners Association (HOA) fees. You may someday sell the house for more than you bought it but, if you paid interest on a mortgage, you also paid far more than the sale price. You have freedom from a landlord, but may discover your HOA is just as controlling, or worse. And then there’s the headache: renting relieves you from the stress of being responsible for repairs. It also offers a freedom of movement that you might cherish.
So, think carefully about whether buying or renting is a better fit for your finances, lifestyle, and future goals. This New York Times rent vs. buy calculator is a good start.
6. Think Even Harder about Having Kids
One father had this to say about children: “They’re a huge source of joy, but they turn every other source of joy to shit.” In fact, having children correlates with both an increased sense of purpose in life and a long-lasting decrease in individual and marital happiness. Having kids means spending a lot of your short life and limited income on one source of joy. It’s not a bad decision. But it’s also not the only good decision you can make. We want to think we can “have it all” but, in fact, it’s a zero sum game. You have only so much time and money and there are lots of ways to find satisfaction, pleasure, and meaning in this life. Consider all your options.
Lisa Wade is a professor of sociology at Occidental College. You can follow her on Twitter and Facebook. Gwen Sharp is a professor of sociology at Nevada State College. You can follow her on Twitter.
Originally posted in 2013 and cross-posted at The Huffington Post and PolicyMic (with gifs!).


