Cross-posted at Reports From the Economic Front.

The media generally talk about the economy in national terms — as if economic trends affect us all equally and we all share a common interest in supporting or opposing the same economic policies.  This comforting view tends to promote political passivity — since we are all in the same “boat,” it makes sense to leave policy making to the experts.

A recently published study on income distribution by economists Anthony Atkinson, Thomas Piketty and Emmanuel Saez stands as a welcome corrective.  Uwe E. Reinhardt discusses some of the main implications of their work in his New York Times blog.

Reinhardt’s Figure 1 shows average annual income growth for households in the United States and the different experiences of the top 1% and the bottom 99%.  From 1976 to 2007, average household income grew at an average annual rate of 1.2%.  Over the same period, the top 1% of households experienced an average annual income gain of 4.4% while the bottom 99% of households gained only 0.6% a year.  Household income gains were higher in both subperiods (1993-2000 and 2002-2007), in large part because these subperiods were recession free.

02economix-growth-chart1-blog480.jpg

Figure 2 shows the share of total income growth in each time period that was captured by the top 1% of households.  Over the years 1976 to 2007, these households captured 58% of all income generated.  Their share was an astounding 65% in the period 2002 to 2007.

02economix-growth-chart2-blog480.jpg

This skewed income distribution means that average income figures present a highly misleading picture of the American experience.  As Reinhardt explains:

So if an American macroeconomist — a specialist who tends to think of nations as people — or high-level government officials or politicians mimicking a macroeconomist boasted on a television talk show that “average family income grew by 3 percent during 2002-7, more than in most European economies,” about 99 percent of American viewers, reflecting on their own experience, would probably scratch their heads and wonder, “What is this guy talking about?”

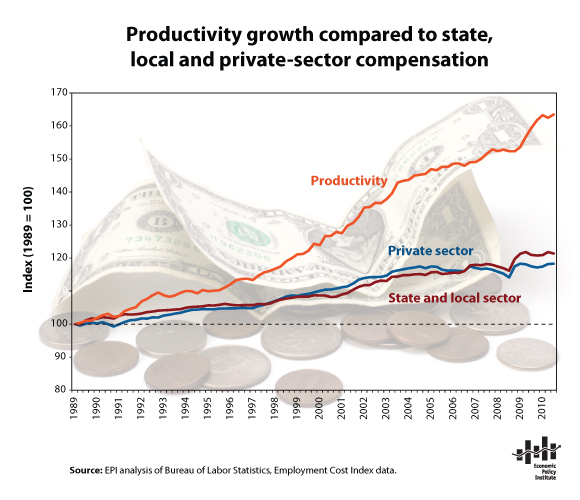
Figure 3 highlights the growth in real GDP per capita and median household income from 1975 to 2007.  The data show a growing divergence between what working people produced and what the average household received from that production.  Real GDP per capita rose by an annual compound rate of 1.9% while real median household income increased by less than 0.5%.

02economix-growth-chart3-blog480.jpg

As Reinhardt points out: “Other than national pride in league tables, that 1.9 percent average economic growth does not mean much for the experience of the median household in the United States.”

This brings us back to the issue of whether it makes sense to talk in “national” terms, especially given the dominance of the top 1% of households.  According to Anthony Atkinson, Thomas Piketty and Emmanuel Saez:

Average real income per family in the United States grew by 32.2 percent from 1975 to 2006, while they grew only by 27.1 percent in France during the same period, showing that the macroeconomic performance in the United States was better than the French one during this period. Excluding the top percentile, average United States real incomes grew by only 17.9 percent during the period while average French real incomes — excluding the top percentile — still grew at much the same rate (26.4 percent) as for the whole French population. Therefore, the better macroeconomic performance of the United States and France is reversed when excluding the top 1 percent.

None of this is to suggest that U.S. society is best understood in terms of a simple division between the top 1% and the bottom 99%; the latter group is far from homogeneous.  Still, this division alone is big enough to establish that talking in simple national terms hides more than it illuminates about the American experience.  Said differently, just because the top 1% of U.S. households have reason to celebrate the U.S. economic model doesn’t mean that the rest of us should join in the celebration.

Cross-posted at Reports from the Economic Front.

The mainstream media works hard to convince us that Republicans and Democrats are locked in heated battle, with each side advocating dramatically different economic policies.  Although there are differences between the two sides, members of both parties generally share common ground in opposing any fundamental changes to the workings of our economy.

A recent International Monetary Fund report on the U.S. economy sheds light on why this is so.  The report includes the following four color-coded charts which compare economic recoveries (including our current one) according to various criteria (each recovery is along the left; criteria of recovery are along the top; red = weakest recoveries, green = strongest recoveries).

imf-us.jpg

As you can see from the red boxes in the first chart (the one titled “Real GDP and components”), our last two recoveries have been quite weak compared with previous recoveries in terms of growth in GDP, personal consumption, and investment in nonresidential structures.  This indicates a growing problem with our economic fundamentals.

The red boxes in the second chart (”Households and employment”) indicate that our last two recoveries have also not been kind to working people as measured by the growth in nonfarm payrolls, unemployment, and disposable income.

However, things look quite different in the last two charts. The green boxes in the third chart (”Business sector”) make clear that the last two expansions have generally been good for nonfinancial corporations.  And the dark green boxes in the fourth chart (”Financial”) highlight the enormous gains made by financial corporations in the last two expansions, and especially the current one.

The take-away from these charts is that business leaders experience our recent recoveries very differently than do the great majority of people.  Despite the fact that growing numbers of workers find it hard to distinguish our expansions from our recessions, business profits keep climbing.  And that is what matters to business. Not surprisingly, then, our corporate leaders are lobbying our political leaders hard not to change existing economic arrangements.  If some austerity is needed to maintain stability–so be it.  And, this lobbying has proven successful.

The connection between deteriorating economic and social conditions and high corporate profitability deserves careful study as does the question of whether this is a stable relationship. Regardless, these charts provide important insight into our national policy-making nexus.  As long as our large corporations are prospering we should not expect our political process to produce meaningful change.  The problem isnt a lack of good ideas for how to strengthen our economy and generate jobs, it is the lack of interest on the part of our elected leaders — on both sides of the aisle — to seriously consider them.  It appears that meaningful economic change will have to await either a further unraveling of our economic and social infrastructure or the rise of a powerful social movement with a new economic vision.

The U.S. economy is in trouble and that means trouble for the world economy.

According to a United Nations Conference on Trade and Development report, “Buoyant consumer demand in the United States was the main driver of global economic growth for many years in the run-up to the current global economic crisis.”

Before the crisis, U.S. household consumption accounted for approximately 16 percent of total global output, with imports comprising a significant share and playing a critical role in supporting growth in other countries.

…as a result of global production sharing, United States consumer spending increas[ed] global economic activities in many indirect ways as well (e.g. business investments in countries such as Germany and Japan to produce machinery for export to China and its use there for the manufacture of exports to the United States).

In short, a significant decline in U.S. spending can be expected to have a major impact on world growth, with serious blow-back for the United States.

There are those who argue that things are not so dire, that other countries are capable of stepping up their spending to compensate for any decline in U.S. consumption. However, the evidence suggests otherwise.As the chart below (from the report) reveals, consumption spending in the U.S. is far greater than in any other country; it is greater than Chinese, German, and Japanese consumption combined.

consumption.jpg

Moreover, there is little reason to believe that the Chinese, German, or Japanese governments are interested in boosting consumer spending in their respective countries.  All three governments continue to pursue export-led growth strategies that are underpinned by policies designed to suppress wage growth (lower wages = cheaper goods = stronger competitiveness in international markets).  Such policies restrict rather than encourage national consumption because they limit the amount of money people have to spend.

For example, China is the world’s fastest growing major economy and often viewed as a potential alternative growth pole to the United States.  Yet, the Economist reveals that the country’s growth has brought few benefits to the majority of Chinese workers.

picture1.jpg

According to the U.S. Bureau of Labor Statistics, despite several years of wage increases, Chinese manufacturing workers still only earn an average of  $1.36 per hour (including all benefits).  In relative terms, Chinese hourly labor compensation is roughly 4 percent of that in the United States.   It even remains considerably below that in Mexico.

Trends in Germany, the other high-flying major economy, are rather similar. As the chart below shows, the share of German GDP going to its workers has been declining for over a decade.  It is now considerably below its 1995 level.  In fact, the German government’s success in driving down German labor costs is one of the main causes of Europe’s current debt problems — other European countries have been unable to match Germany’s cost advantage, leaving them with growing trade deficits and foreign debt (largely owed to German banks).

germany.jpg

The Japanese economy, which remains in stagnation, is definitely unable to play a significant role in supporting world growth.  Moreover, as we see below, much like in the United States, China, and Germany, workers in Japan continue to produce more per hour while suffering real wage declines.

japan.gif

For a number of years, world growth was sustained by ever greater debt-driven U.S. consumer spending.  That driver now appears exhausted and U.S. political and economic leaders are pushing hard for austerity.  If they get their way, the repercussions will be serious for workers everywhere.

Our goal should not be a return to the unbalanced growth of the past but new, more stable and equitable world-wide patterns of production and consumption.  Achieving that outcome will not be easy, especially since as the United Nations Conference on Trade and Development’s World Investment Report 2011 points out, transnational corporations (including their affiliates) currently account for one-fourth of global GDP.Their affiliates alone produce more than 10 percent of global GDP and one-third of world exports.  And, these figures do not include the activities of many national firms that produce according to terms specified by these transnational corporations.   These dominant firms have a big stake in maintaining existing structures of production and trade regardless of the social costs and they exercise considerable political influence in all the countries in which they operate.

Cross-posted at Reports from the Economic Front.

Social Security is in Danger

The recently approved deficit reduction plan includes the establishment of a Congressional super committee that is supposed to propose ways to achieve $1.2-1.5 trillion in deficit reduction over the next ten years. Everything is on the table, including Social Security. It must complete its work by November 23, 2011.

While the committee could decide to spare Social Security, the odds are great that its final proposal will include significant benefit cuts. Most Republicans have long sought to dismantle the program and President Obama is willing to accept a reduction in Social Security benefits for the sake of deficit reduction.  Standard and Poor’s downgrade of the federal government’s credit rating only adds to the pressure.  The rating agency explained its decision as follows:

We lowered our long-term rating on the U.S. because we believe that the prolonged controversy over raising the statutory debt ceiling and the related fiscal policy debate indicate that further near-term progress containing the growth in public spending, especially on entitlements, or on reaching an agreement on raising revenues is less likely than we previously assumed and will remain a contentious and fitful process.

Why Social Security is Important

There has been little media discussion of the importance of Social Security to those over 65.  According to the Economic Policy Institute:

The average annual Social Security retirement benefit in 2009 was $13,406.40, slightly above the $10,289 federal poverty line for individuals age 65 and older, but less than the minimum wage. While modest in size, Social Security benefits comprise a substantial share of household income for most elderly recipients.

The chart below shows that the poorest 40% of households with a head 65 years or older rely on social security for more than 80% of their income. Even the middle 20% depend on social security for more than 60% of their income. In sum, cutting social security benefits will hit hard at the great majority of seniors.

ss.jpg
How the Change Will Undermine Benefits

If the super committee does decide to go after social security, it will likely do so by proposing that social security benefits be adjusted using a new measure of inflation. Right now benefits are adjusted using the CPI-W, which measures the change in prices of goods and services commonly consumed by urban wage earners and clerical workers. The new measure is called the Chained Consumer Price Index for all Urban Consumers.

This all sounds very technical, but the basic idea is simple. The CPI-W measures the increase in the cost of a relatively fixed bundle of goods and services. The Chained Consumer Price Index assumes that consumers continually adjust their purchases, giving up those goods and services that are expensive in favor of cheaper substitutes. The chained index would produce a lower rate of inflation because the goods and services whose prices are rising the fastest would be dropped from the index or given lower weight. The result would be a smaller annual cost of living adjustment for those receiving Social Security, thereby cutting Social Security outlays.

Those who support using a chained index argue that it is a more accurate measure of inflation than the CPI-W. In reality, it just masks the fact that people are unable to buy the goods and services they once enjoyed. If we are really concerned about accuracy, we could use the CPI-E, which measures the change in prices of those goods and services commonly consumed by seniors. The CPI-E has risen much faster than the CPI-W, demonstrating that current cost of living adjustments are actually too low, not too high.

The following chart should leave no doubt as to what is at stake in this “technical” adjustment.  A medium earner retiring this year at age 65 would receive $15,132.  The retiree’s real (inflation adjusted) earnings would remain constant over time assuming that Social Security benefits were adjusted using the existing CPI-W.  If benefits were adjusted using the proposed Chained CPI, the retiree’s real earnings would steadily decline, falling to $13,740 at age 95.  By comparison, benefits would grow to $16,131 if the CPI-E were used.
social-security-graph.jpg
Why Social Security is the Wrong Target

Social Security shouldn’t be on the cutting board at all.   It is a self-financing system, one with a large surplus.  Some analysts say that the system will not have sufficient funds to meet its obligations by 2037.  In fact, this claim is based on very extreme and unlikely assumptions about future economic activity.  But, even if we accept these assumptions, we can easily escape the predicted crisis by applying the Social Security tax to labor income above $106,800.  Currently, earnings above that amount are exempt from the tax.  Removing the tax ceiling would ensure the solvency of Social Security through the next 75 years.

Cross-posted at Reports from the Economic Front.

Congress has finally agreed on a deficit reduction plan that President Obama supports. As a result, the debt ceiling is being lifted, which means that the Treasury can once again borrow to meet its financial obligations.

Avoiding a debt default is a good thing. However, the agreement is bad and even more importantly the debate itself has reinforced understandings of our economy that are destructive of majority interests.

The media presented the deficit reduction negotiations as a battle between two opposing sides. President Obama, who wanted to achieve deficit reduction through a combination of public spending cuts and tax increases, anchored one side. The House Republicans, who would only accept spending cuts, anchored the other. We were encouraged to cheer for the side that we thought best represented our interests.

Unfortunately, there was actually little difference between the two sides in terms of the way they engaged and debated the relevant issues. Both sides agreed that we face a major debt crisis. Both sides agreed that out-of-control social programs are the main driver of our deficit and debt problems. And both sides agreed that the less government involvement in the economy the better.

The unanimity is especially striking since all three positions are wrong. We do not face a major debt crisis, social spending is not driving our deficits and debt, and we need more active government intervention in the economy, not less, to solve our economic problems.

So what was the deal?

Before discussing these issues it is important to highlight the broad terms of the deficit reduction agreement. The first step is limited to spending cuts; discretionary spending is to be reduced by $900 billion over the next ten years. Approximately 35% of the reduction will come from security-related budgets (military and homeland security), with the rest coming from non-security discretionary budgets (infrastructure, energy, research, education, and social welfare). In exchange for these budget cuts the Congress has agreed to raise the debt ceiling by $1 trillion.

The agreement also established a 12 person committee (with 6 Democrats and 6 Republicans) to recommend ways to reduce future deficits by another $1.2-1.5 trillion. Its recommendations must be made by November 23, 2011 and they can include cuts to every social program (including Social Security, Medicare and Medicaid), as well as tax increases.

Congress has to vote on the committee’s package of recommendations by December 23, 2011, up or down. If Congress approves them they will be implemented. If Congress does not approve them, automatic cuts of $1.2 trillion will be made; 50% of the cuts must come from security budgets and the other 50% must come from non-security discretionary budgets. Regardless of how Congress votes on the recommendations, it must also vote on whether to approve a Balanced Budget Amendment to the Constitution. Once this vote is taken, the debt ceiling will be raised again by an amount slightly smaller than the deficit reduction.

Check out this flowchart from the New York Times if you want a more complete picture of the process.

Why is this a problem?

Those who favor reducing spending on government programs generally argue that we have no choice because our public spending and national debt are out of control, threatening our economic future. But, the data says otherwise.

The chart below, from the economist Menzie Chinn at Econbrowser, shows the movement in the ratio of publically held debt to GDP over the period 1970 to 2011; the area in yellow marks the Obama administration. While this ratio has indeed grown rapidly, it remains well below the 100% level that most economists take to be the warning level. In fact, according to Congressional Budget Office predictions, we are unlikely to reach such a level for decades even if we maintain our current spending and revenue patterns.

The sharp growth in the ratio over the last few years strongly suggests that our current high deficits are largely due to recent developments, in particular the 2001 and 2003 Bush tax cuts, the wars in Iraq and Afghanistan, and the Great Recession. Their contribution can be seen in this chart from the New York Times.

The effects of the tax cuts and economic crisis on our deficits (and by extension debt) are especially visible in the following chart (again from Menzie Chinn), which plots yearly changes in federal spending and federal revenue as a percentage of GDP (the shaded areas mark periods of recession). As we can see, the recent deficit explosion was initially driven more by declining revenues than out of control spending. Attempts to close the budget gap solely or even primarily through spending cuts, especially of social programs, is bound to fail.


To summarize:

Tragically, the debate over how best to reduce the deficit has encouraged people to blame social spending for our large deficits and those large deficits for our current economic problems.  As a result, demands for real structural change in the way our economy operates are largely dismissed as irrelevant.

Recent economic data should be focusing our attention on the dangers of a new recession.  According to the Commerce Department our economy grew at an annual rate of just 1.3% in second quarter of this year, following a first quarter in which the economy grew by only 0.3%.  These are incredibly slow rates of growth for an economy recovering from a major recession.  To put these numbers in perspective, Dean Baker notes that we need growth of over 2.5% to keep our already high unemployment rate from growing.

Cutting spending during a period of economic stagnation, especially on infrastructure, research, and social programs, is a recipe for greater hardship.  In fact, such a policy will likely further weaken our economy, leading to greater deficits.  This is what happened inthe UK, Ireland, and Greece—countries with weak economies that tried to solve their deficit problems by slashing public spending.

We need more active government intervention, which means more spending to redirect and restructure the economy; a new, more progressive tax structure; and a major change in our foreign policy, if we are going to solve our economic problems.  Unfortunately for now we don’t have a movement powerful enough to ensure our side has a player in the struggles that set our political agenda.


Cross-posted at Reports from the Economic Front.

The Wall Street Journal recently surveyed more than 50 economists, asking them what they thought was the main reason U.S. firms were not hiring more workers.  Approximately 65% answered that it was a lack of demand for goods and services, 27% thought it was uncertainty about government policy, and 8% said it was the existence of more “favorable” hiring conditions overseas.

One might think that with so many economists citing a lack of demand as the primary reason for our continuing high rate of unemployment, those same economists would argue that getting more money into the pockets of working people would be a good strategy for recovery. But did the survey also reveal strong support by economists for a higher minimum wage, new union-friendly labor laws, a single payer health plan, an increase in social security payments, an aggressive industrial policy? No.

In fact, according to the Wall Street Journal, “Despite their forecasts for slow growth and an elevated unemployment rate, the economists aren’t in favor of futher action either by the Fed or the Federal government.”  In other words there was no support for policies (micro or macro) that would dramatically change the economic environment.

There is good reason for rejecting this preference for the status quo.  Take a look at the chart below which comes from an article in Investor’s Business Daily.  Each point on the chart shows the change in total wages (adjusted for inflation) over the previous ten years.


wage-depression.png

As the article notes:

The past decade of wage growth has been one for the record books — but not one to celebrate.

The increase in total private-sector wages, adjusted for inflation, from the start of 2001 has fallen far short of any 10-year period since World War II, according to Commerce Department data. In fact, if the data are to be believed, economy-wide wage gains have even lagged those in the decade of the Great Depression (adjusted for deflation).

Two years into the recovery, and 10 years after the nation fell into a post-dot-com bubble recession, this legacy of near-stagnant wages has helped ground the economy despite unprecedented fiscal and monetary stimulus — and even an impressive bull market.

Over the past decade, real private-sector wage growth has scraped bottom at 4%, just below the 5% increase from 1929 to 1939, government data show.

To put that in perspective, since the Great Depression, 10-year gains in real private wages had always exceeded 25% with one exception: the period ended in 1982-83, when the jobless rate spiked above 10% and wage gains briefly decelerated to 16%.

In other words, we are experiencing a steady and long term decline in total real wages, one that was worsened but not caused by the Great Recession.  Thus, there is little reason to believe that maintaining existing policies will lead to any meaningful increase in wages and, by extension, overall demand and employment.

How did the economy grow over the last decade despite this decline in wages?  As we known, the answer was a debt-driven housing bubble.  How is the economy growing now that the housing bubble has popped?  Here is the answer given by Investor’s Business Daily:

So how has the economy managed to scale new GDP heights despite sagging real wages?

Real disposable income is up 3.6% since December 2007, thanks to nearly $1 trillion in government support via higher social benefits (up $583 billion since the recession began); lower tax bills (down $255 billion); and higher government wages and benefits (up about $125 billion).

Absent those sources of support, real disposable income would still be 5% below its prior peak.

What the article doesn’t mention is that in contrast to the decline in total real wages, corporate profits and stock prices have been soaring.  In fact, the trends are related: the decline in wages is one of the main reasons for the growth in profits and stock prices.  Economists at the Center for Labor Market Studies discuss these trends and their relationship in a recent study, which includes the following table:

sum_etal.png

With these trends in mind the professional consensus for the status quo becomes easier to understand.  So does the need to actively oppose it.


Cross-posted at Reports from the Economic Front.

Austerity advocates talk about government spending as if its impact on the economy is marginal. In their world, we can slash spending with few if any consequences for our roads and bridges; transportation, health care, and educational systems; research and development activity; investment in plant and equipment; employment and wage levels; economic growth . . . the list goes on.

That may be how it looks in their world, but in the real world it is quite different. Looking just at personal income, for example, the New York Times reports that:

An extraordinary amount of personal income is coming directly from the government.

Close to $2 of every $10 that went into Americans’ wallets last year [2010] were payments like jobless benefits, food stamps, Social Security and disability, according to an analysis by Moody’s Analytics. In states hit hard by the downturn, like Arizona, Florida, Michigan and Ohio, residents derived even more of their income from the government.

If the austerity advocates have their way, public spending will be cut. However, as the information in the box below reveals, the consequences will be severe for our entire economy, not just for those individuals directly receiving support. As the New York Times explains, “Throughout the recession and its aftermath, government benefits have helped keep money in people’s wallets and, in turn, circulating among businesses. Total government payments rose to $2.3 trillion in 2010, from $1.7 trillion in 2007, an increase of about 35 percent.”

We definitely need to remake our political-economy. However, it is madness to think that destroying the social infrastructure underpinning current economic activity is a productive way to achieve that goal.

The struggles in Madison have understandably focused attention on the wages and working conditions of public sector workers.  Thankfully, it appears that these struggles have helped to promote greater solidarity between public and private sector workers.  Now, we must build on this new solidarity to focus our collective energies on the bigger challenge: transforming a system that demands that workers (in both the public and private sector) accept ever worsening living and working conditions.

As many involved in the Wisconsin struggles have pointed out, there is plenty of wealth being produced—the problem is that those who are doing the producing are being increasingly denied access to it, both collectively and individually.  For example, as the Economic Policy Institute points out:

U.S. productivity grew by 62.5% from 1989 to 2010, far more than real hourly wages for both private-sector and state/local government workers, which grew 12% in the same period. Real hourly compensation grew a bit more (20.5% for state/local workers and 17.9% for private-sector workers) but still lagged far behind productivity growth.

The chart below highlights this development.  As one can see, the real issue isn’t whether public sector workers make more or less than private sector workers (and the chart covers compensation which includes pay and benefits).  Rather it is that workers together have been increasingly productive but receving an increasingly smaller share of the fruits of their labor.    Those who are well place to benefit, those at the very top of the income scale, have of course done quite well.  For example, the richest 1% received 56% of all the income growth between 1989 and 2007 (before the start of the recession).  By contrast the bottom 90% got only 16%.

If we want to change this we are going to have to build a powerful political movement, one that is prepared to take on the powerful interests that are determined to keep spending on the military; privatizing our educational, health, and retirement systems; promoting corporate mobility; weakening labor laws; and confusing us all about the causes of existing trends.


——————————

If you would like to write a post for Sociological Images, please see our Guidelines for Guest Bloggers.