Click here to see a flickr slide show of dozens of people, starting with those below, with their BMI label (“underweight,” “normal,” “overweight,” “obese,” and “morbidly obese”). There’s something about seeing all these nice looking people with these judgmental labels applied to them that reveals that the BMI is a social construction. Also it’s a good illustration of the Foucauldian idea that knowledge (discourse, or even “science”) is used to label and control people, especially when it is internalized.

Erin Nieto’s project, How Much Do You Weigh, also puts the body front-and-center, challenging us re-think what numbers mean.  She counterposes photographs of volunteers with the number on the scale.  These women model a refusal to be embarrassed by their weight and show us the imprecision of the number itself.

See more images at Nieto’s tumblr.

Lisa Wade, PhD is an Associate Professor at Tulane University. She is the author of American Hookup, a book about college sexual culture; a textbook about gender; and a forthcoming introductory text: Terrible Magnificent Sociology. You can follow her on Twitter and Instagram.

Two years ago we posted about the Ashley Madison Agency. Several readers brought our attention to a new ad campaign for the company, so we’re reposting it; scroll down for new material.

Lisa C. sent in a link to the Ashley Madison Agency, which she heard advertised on a talk radio station that generally targets a male audience. The site specializes in providing dating services to married individuals looking to have an affair:

picture-12

The company clearly plays on its notoriety and the shock value of the idea that a dating site would cater to married people looking to cheat on their partners — as well as, in this case, appearing to promise men oral sex.

The company has come out with a new ad campaign that has received significant criticism. The ads, sent in by Danielle Q., Christie W., and an anonymous reader, combine “promotion of adultery, body shaming, and female objectification,” according to Christie. They present wives as fat (and therefore presumably unappealing) women who practically drive men to cheat on them with the thin, hot women they deserve to have sexual access to:

(Via.)

(Via Jezebel.)

One source of criticism comes from Jacqueline, the plus-sized model used in the two images. She apparently posed for a photographer years ago and is now faced with seeing her image used to elicit disgust at large bodies. As Jacqueline pointed out in a post she wrote for Jezebel, these images aren’t just about mocking large women; they’re about policing all women’s bodies:

A size 2 woman who sees this ad sees the message: “If I don’t stay small, he will cheat”. A size 12 woman might see this ad and think “if I don’t lose 30lbs, he will cheat”. A size 32 woman could see this ad, and feel “I will never find love”.

Thus, all women are told that they are perpetually in competition with all other women for the sexual attention and approval of men, and always on the verge of being ridiculed for the failure to meet impossible standards of feminine attractiveness.

Although Republicans and President Obama are said to disagree about economic policies, there is one initiative that they both enthusiastically support: free trade agreements.  President Obama single-handily resurrected the free trade agreements with Korea, Panama, and Colombia from political oblivion; they were ratified by the U.S. Congress in October.   

Now, he is eagerly pursuing a new multilateral agreement known as the Trans-Pacific Free Trade Agreement (involving Australia, Brunei Darussalam, Chile, Malaysia, New Zealand, Peru, Singapore, Vietnam, and the United States).  Significantly, as Public Citizen reports, “a leaked document revealed that the Obama administration signed a special pact to keep all documents relating to the Trans-Pacific Free Trade Agreement negotiations secret.” 

One might ask why the leaders of so many countries are anxious to sign such agreements, agreements which not only lower tariffs but also strip away the powers of governments to regulate international investment, production, and capital flows.

One answer is the enormous economic power of transnational corporations (TNCs), the main beneficiaries of these agreements. According to the United Nations Conference on Trade and Development:

TNCs worldwide, in their operations both at home and abroad, generated value added of approximately $16 trillion in 2010, accounting for more than a quarter of global GDP. In 2010, foreign affiliates accounted for more than one-tenth of global GDP and one-third of world exports.  

tnc1.jpg

The largest transnational corporations are from developed capitalist countries.  These corporations also tend to be among the largest and most powerful firms in their respective home countries.  At the same time, as the table below shows, their international operations now account for a majority of their assets, sales, and employment.  Looking at all TNCs, the United Nations reports that the value added by their foreign affiliates generated approximately 40% of their total value added in 2010, up from 35% in 2005.

tnc2.jpg

The estimates of TNC production cited above, although impressive, actually understate transnational control over global economic activity.  At one time, TNCs only engaged in international production through establishment of foreign affiliates.  In some cases, the parent company and its foreign affiliates operated relatively independently, each serving a different market. 

Now, transnational corporations generally rely on complex cross border production networks that involve the linking of production across many countries, with final sales often taking place in still other countries. Most importantly, these networks often include “independent” partner firms that undertake various activities according to an overall transnational corporate strategy.  While some of the partner firms may themselves be transnational corporations, many are not, which means that TNC controlled activity is greater than the combined activities of parent and affiliate firms. 

Transnational corporations use a variety of so-called “non-equity modes” (NEMs) of control to direct the operations of their partner firms, with contract manufacturing and service outsourcing among the most important. Cross border activity involving NEM relationships is conservatively estimated to have generated over $2 trillion of sales in 2010.  The United Nations reports that some 18–21 million workers are directly employed in firms operating under NEM arrangements. Around 80 per cent of NEM-generated employment is in developing and transition economies.

As the following figure reveals, cross border production activity anchored by NEM relations now dominates a number of key export industries.  For example, NEM production now accounts for more than 50% of all toy, footwear, garment and electronics exports.

 selected-exports.jpg 

The production of the iPhone offers one of the best examples of the logic and operation of these transnational corporate controlled cross border production networks.  As the Asian Development Bank explains:

iPhones are designed and marketed by Apple, one of the most innovative U.S. companies. Apart from its software and product design, the production of iPhones primarily takes place outside the US. Manufacturing iPhones involves nine companies, which are located in the PRC, the Republic of Korea (hereafter Korea), Japan, Germany, and the US. The major producers and suppliers of iPhone parts and components include Toshiba, Samsung, Infineon, Broadcom, Numunyx, Murata, Dialog Semiconductor, Cirrius Logic, etc. All iPhone components produced by these companies are shipped to Foxconn, a company from Taipei,China located in Shenzhen, PRC, for assembly into final products and then exported to the US and the rest of the world.

Not surprisingly, the division of profits, as shown below, reflects the overall hierarchy that structures this and other cross border production networks.

iphone.jpg

The importance of cross border production networks to transnational corporate profitability helps to explain why these corporations are such strong supporters of free trade agreements.  And, although I have focused on manufacturers, transnational retailers which sell the products produced by these networks and financial service companies which underwrite both the production and consumption of these products are also major beneficiaries and therefore powerful advocates. 

The operation of these networks, the majority of which are centered in East Asia, have greatly contributed to the growth of global imbalances, marked by East Asian trade surpluses and U.S. trade deficits.  These imbalances were papered over, and global capitalist accumulation sustained only because of the debt-driven housing bubble which financed U.S. consumption. 

The collapse of the bubble has led many analysts to call for a rebalancing of Asian and U.S. economies. However, rather than address this need, governments throughout the world, responding to dominant capitalist interests, continue to pursue new free trade agreements, a pursuit that if successful will only intensify existing economic and social problems and make needed changes harder to achieve.   

The author of Soundbitten: The Perils of Media-Centered Political Activism, Tufts University sociology professor Sarah Sobieraj is a reigning expert on media and social movements in the U.S.  In the four minute clip below, she discusses what it is about the Occupy Movement that has led to such favorable coverage. This includes an answer to the now ubiquitous question: “Is their message too broad?”

Clip at MyFoxBoston, via Citings and Sightings.

Lisa Wade, PhD is an Associate Professor at Tulane University. She is the author of American Hookup, a book about college sexual culture; a textbook about gender; and a forthcoming introductory text: Terrible Magnificent Sociology. You can follow her on Twitter and Instagram.

Cross-posted at The Sociological Cinema.

Back in 2007, Dr. Oz stood on the set of The Oprah Winfrey Show and infamously promoted to an audience of 8 million viewers the idea that African Americans experience higher rates of hypertension because of the harsh conditions their ancestors endured on slave ships crossing the Atlantic. This so-called “slave hypothesis” has been roundly criticized for good reason, but I was struck that it was being promoted by such a highly educated medical professional.

The episode got me thinking about the sociologists Omi and Winant’s notion of a racial formation as resulting from historically situated racial projects wherein “racial categories are created, inhabited, transformed, and destroyed” (p. 55-56). These projects take multiple forms but in at least one version, there is an attempt to collapse race—a socially constructed concept—into biology. Such projects are similar insofar as they suggest that the socially constructed distinctiveness between people of different racial categories roughly approximates a meaningful biological distinctiveness. Scientists have been centrally involved in this effort to establish a biological basis for race. In the middle of the 19th century Dr. Samuel Morton attempted to show that average cranial capacities of people from different racial groups were significantly different. Today, many people scoff at the misguided racism of the past, but I think Dr. Oz’s promotion of the slave hypothesis demonstrates that the search for a biological, and therefore “natural,” basis for race continues.

So how do proponents of the slave hypothesis explain hypertension? In 1988 Dr. Clarence Grim first proposed the theory, which is the idea that the enslaved people who survived the Middle Passage were more likely to be carriers of a gene that allowed them to retain salt. Grim argued that this ability to retain salt, while necessary for a person to survive the harsh conditions of a slave ship, would ultimately lead to hypertension as the person aged. Thus Grim proposed that African Americans living in the United States today are the descendants of people who have this selected feature. As I mentioned above, this theory has been soundly refuted but reportedly still remains in many hypertension textbooks. Looking at the clip above, which is from January of this year, it seems that medical professionals like Dr. Oz may be still promoting it.

I think it is important to recognize that this particular racial project persists in many forms, and one final example is from 2005, when the FDA approved BiDil as a customized treatment of heart failure for African Americans. The approval was based on highly criticized research, but the approval also implicitly makes the case that a racial group might be so biologically distinct from others as to warrant its own customized medication. Much like the search for different cranial capacities, the propagation of the slave hypothesis, and the marketing of drugs designed for different racial groups, BiDil’s emergence can be seen as an attempt to deploy racial categories as if they were immutable in nature (see Troy Duster’s article in Science).

Criticizing this racial project is more than an academic exercise. As a social construct, race is already a central principal of social organization, which benefits whites at the expense of other racial groups. It is already a powerful basis upon which privileges are meted out and denied. In my view, the effort to loosen race from its moorings as a social construct and anchor it again as a biological fact of nature is an attempt to fundamentally alter the discussion on racial inequality. If this project prevails and race comes again to reflect a biological truth, then fewer people will acknowledge racial inequality as the result of a human-made history. It will instead be seen as the result of humans being made differently.

———-

Lester Andrist is a Ph.D. candidate at the University of Maryland, College Park, specializing in the role of social capital and personal networks in finding jobs in India and Taiwan and cultural representations of groups in indefinite detention. He is a co-editor of the website The Sociological Cinema.

If you would like to write a post for Sociological Images, please see our Guidelines for Guest Bloggers.

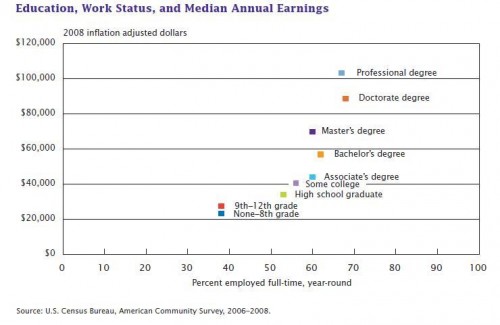
The Census Bureau posted some information about the economic payoff of a college degree on their blog, Random Samplings. A recent report indicated that educational level had a bigger impact than any other demographic factor on lifetime earnings. More education leads to both higher incomes not just because those with more education receive higher salaries, but also because they are more likely to be in full-time jobs. The x-axis here shows the % of people in full-time, year-round jobs:

Not surprisingly, the gap in earnings widens over time, especially for those with a bachelor’s or higher degree compared to those with less:

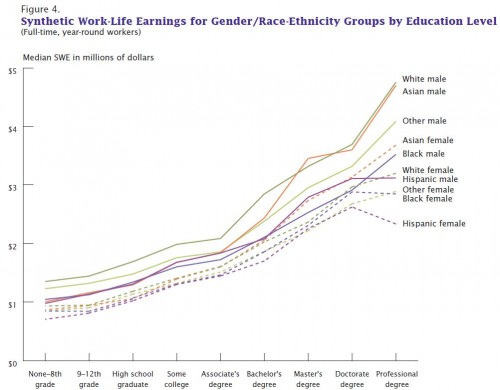
The report also estimated lifetime earnings by race/ethnicity for men and women separately. As they point out, except for a couple of cases at the very highest educational levels, men from even the most economically disadvantaged racial/ethnic groups out-earn women from the most economically advantaged ones:

Of course, not all college degrees are equal. Dolores R. sent in a link to an interactive table from the Wall Street Journal that lets you look at earnings and the unemployment rate for various majors. I sorted them by median earnings; here are the ten with the lowest median earnings:


And the ten with the highest:

The highest unemployment rate? Clinical psychology, at 19.5%.

You can also search by area (art, engineering, etc.), though it looks like the categorization may be a little sketchy — for instance, “geology and earth science” and “liberal arts” show up under the arts.

For more on college majors, earnings, and future career opportunities, see the report College Clusters: Forecasting Demand for High School through College Jobs, 2008-2018, from the Georgetown University Center on Education and the Workforce.

Cross-posted at Montclair SocioBlog.

We’ve known for a long time that surveys are often very bad at predicting behavior.  To take the example that  Malcom Gladwell uses, if you ask Americans what kind of coffee they want,  most will say “a dark, rich, hearty roast.”  But what they actually prefer to drink is “milky, weak coffee.”

Something that sounds good in the abstract turnsout to be different from the stuff you actually have to drink.

Election polls usually have better luck since indicating your choice to a voting machine isn’t all that different from speaking that choice to a pollster.  But political preference polls as well can run into that abstract-vs.-actual problem.

Real Clear Politics recently printed some poll results that were anything but real clear.  RCP looked at polls matching Obama against the various Republican candidates.  In every case, if you use the average results of the different polls, Obama comes out on top. But in polls that matched Obama against “a Republican,” the Republican wins.

The graph shows only the average of the polls.  RCP also provides the results of the various polls (CNN, Rasmussen, ABCl, etc.)

Apparently, the best strategy for the GOP is nominate a candidate but not tell anyone who it is.


Cross-posted on Reports from the Economic Front.

The Occupy Movement has clearly transformed conversations about the economy.  It is now inequality — in particular, the gap between the top 1% and everyone else — rather than the national debt that dominates the news.

To review, this gap is real, as the following charts from the Economic Policy Institute make clear.  This chart shows the percentage increase in household income over the period 1979 to 2007 by income group.  While the top 1% enjoyed income gains of 224% over the period, the gains enjoyed by the bottom 90% were far more modest: 5%.  Equally striking is the fact that the household income of top 0.01% shot up an astounding 390%.

income-growth.jpg

Unfortunately, there is another income gap that has not received nearly as much attention.  It is the white-nonwhite gap.  The Portland, Oregon based Coalition of Communities of Color recently published a report on the socioeconomic situation of people of color in Multnomah Country (which includes Portland).

As the chart below reveals, the mean income of families of color in the top decile (10%) actually declined by $6,002 over the years 1979 to 2007.  By contrast, the mean income of white families in the top 10%  rose by $122,591.  White families and families of color in the bottom half of the distribution all suffered losses.

multnomah.jpg

The following two charts show the mean earnings of each group by decile and their change between 1979 and 2007.

Portrait in 1979:

1979.jpg

Portrait in 2007:

2007.jpg

This last chart shows poverty rates by color.  Clearly, as we work to create a more equitable society, our efforts must also be guided by awareness of the existence of serious racial and ethnic inequities.

poverty.jpg