Now that we’re in the last full week of the presidential campaign, let’s look at voting patterns in the U.S. Who votes in national elections? And how many of us do so?
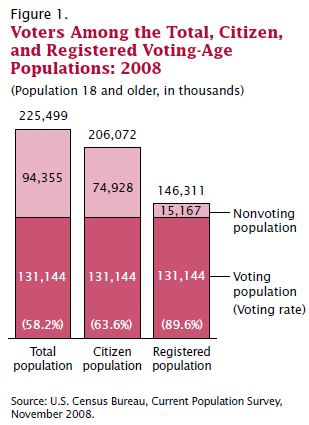
Voter turnout data is often somewhat misleading. The turnout rate is often reported as a % of the total voting-age population — that is, what percentage of people over age 18 voted? But that broad measure of voter turnout will be artificially low because it includes non-citizens living in the U.S., who aren’t eligible to vote. A more accurate measure would be to look at turnout among citizens over age 18; as we see in the data from the 2008 presidential election, the difference between these two measures of voter turnout was more than 5 percentage points:
It’s worth noting that the citizen measure doesn’t reflect those citizens who have been disenfranchised because they live in a state where individuals convicted of felonies lose the right to vote, often permanently.
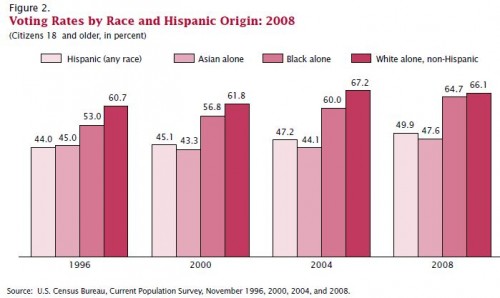
If we look at voter turnout among citizens in 2008, we see significant differences by race/ethnicity. White non-Hispanics have the highest turnout, with African Americans about 5-7 percentage points behind, though the gap narrowed in 2008. Asian Americans and Hispanics are less likely to vote, with just under half of eligible citizens from these two groups voting in 2008:
Both parties are keenly aware of the steady growth in voter turnout among Hispanics; as the largest racial/ethnic minority group in the U.S., increasing participation in elections promises growing political influence in the future, a source of both opportunities and challenges for the parties as they vie for those votes.
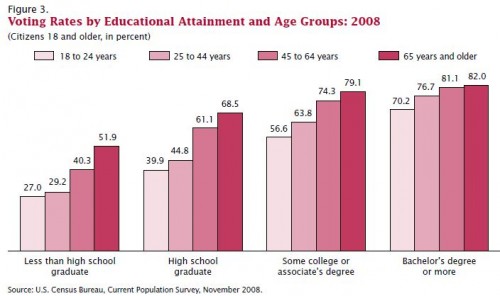
Not surprisingly, age and education affect voting behavior. Within every educational level, the voting rate goes up steadily with age.
For more information on voting patterns, the Census Bureau has an interactive website that lets you select elections between 1996 and 2010 and see a map and graphs broken down by sex, race/ethnicity, age, and so on.
Gwen Sharp is an associate professor of sociology at Nevada State College. You can follow her on Twitter at @gwensharpnv.


Comments 6
OVERVIEW OF U.S. VOTER TURNOUT | Welcome to the Doctor's Office — October 29, 2012
[...] from SocImages [...]
Anna — October 29, 2012
"[ individuals] convicted of felonies lose the right to vote, often permanently."
Unfortunately, this link doesn't work for me. There is some information about losing the right to vote online - was the specific link a basic overview of the issue? I'd never heard about this before. It's a really interesting social topic, I'm glad to have come across it here.
James Jordan — August 4, 2023
I think it is important to understand the factors that affect voter turnout and how they impact the political landscape of the U.S. I wonder what are some of the reasons behind the lower turnout rates among Asian Americans and Hispanics.
Masonry contractor in West Palm Beach
Hello Neighbor — March 7, 2024
Fantastic, I think it's the greatest one out there, so tell me what you think! Best of luck!
nhiunhe — March 7, 2024
Even though I lack the necessary expertise to help you with this problem. But I really hope someone can assist you in this matter!
Hello Neighbor