
The Pew Research Center has released the results of a poll of 2,508 adults about social class and life experiences.
An important caveat to start with: the poll asked people to categorize themselves as upper (2% of respondents), upper-middle (15%), middle (49%), lower-middle (25%), or lower class (7%). We know that there’s a tendency among people in the U.S. to identify as middle class, even when their actual income falls far below or above what could reasonably be considered middle class, and the survey didn’t ask about incomes or assets to compare to individuals’ self-identification. There’s likely to be some overlap between the categories if we actually looked at the income/wealth of participants. The graphs below combine those who defined themselves as upper or upper-middle class together into the “upper class” category, while those who said lower-middle are assigned to the “lower class” group.
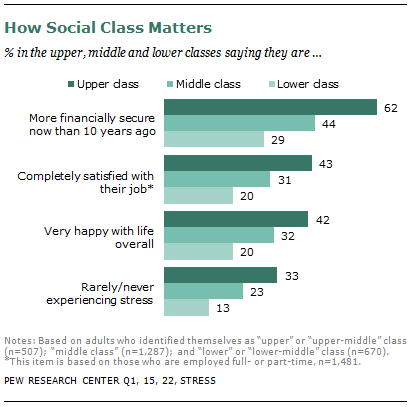
Not surprisingly, there were large differences by social class in a number of quality-of-life areas. The higher one’s class, the more likely they were to say they were better off than they were 10 years ago and were happy with life and rarely experience stress (though apparently we’re generally pretty stressed overall):
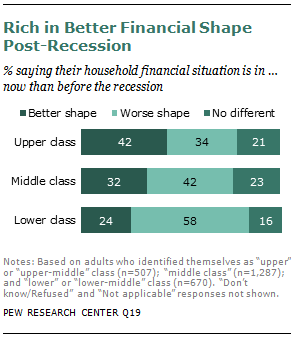
The lower class is much more likely than the other groups to say they are in worse shape than they were before the recession, indicating that they continue to suffer disproportionately from the effects of the economic meltdown and the slow recovery:
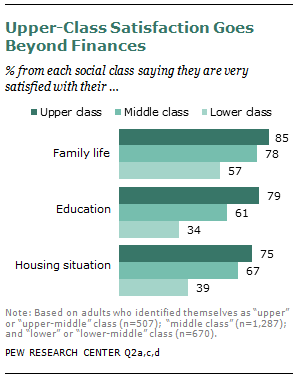
Those defined as lower class were much less satisfied with family life, their level of education, and their housing situation:
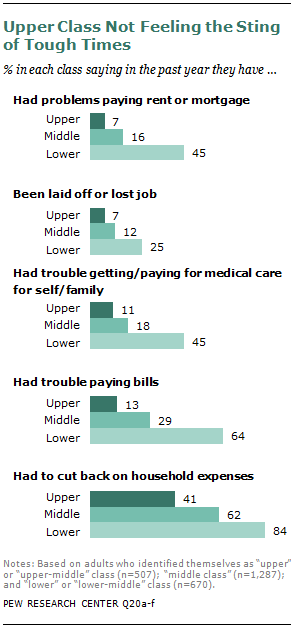
They were also much more likely to report specific difficulties in the past year, including trouble paying rent/mortgage and other bills, losing a job, and problems paying for medical care:
The results show a consistent, unsurprising pattern: the rich are weathering the slow recovery relatively well, while the poor suffer disproportionately. Check out the full report for information on participants’ perceptions of the wealthy, the fairness of the tax burden across classes, and which political party best represents each group.
Comments 4
Mr. P — August 29, 2012
Couldn't you interpret cause and effect in the opposite direction? That people who are better off today than 10 years ago are more likely to identify themselves as "upper class," and those who are worse off would identify themselves as "lower class"?
I think the same interpretation can be applied across all these results. Someone struggling with expenses, late or their mortgage, or unhappy with their housing situation is far more likely to identify as "lower class" than "upper class."
While these classifications (and income brackets) are generally fixed over time, the flesh and blood individuals who comprise each bracket change. I think that's an important distinction to make when interpreting data like these.
SOCIAL CLASS AND WELL-BEING « Welcome to the Doctor's Office — August 29, 2012
[...] from SocImages [...]