Note: Since I posted this, Philip Cohen has brought up concerns about the National Marriage Project’s data and analysis in another study. You might want to take a look at his post.
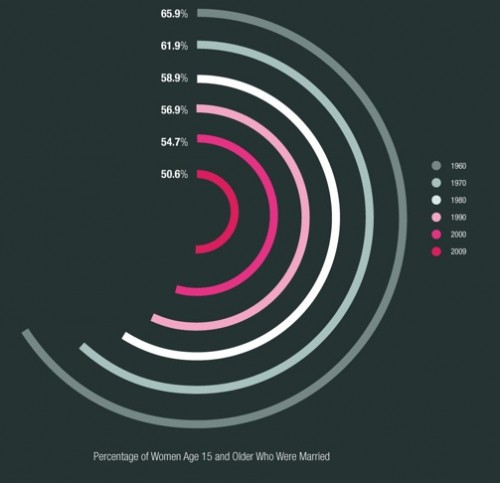
Patricia P. sent in an infographic illustrating trends in marriage, divorce, and cohabitation over the last several decades, based on data from the National Marriage Project at the University of Virginia. I found several of the images to be a bit cluttered and unclear, but this one neatly summarizes the percent of women over age 15 who were currently married, 1960-2009:
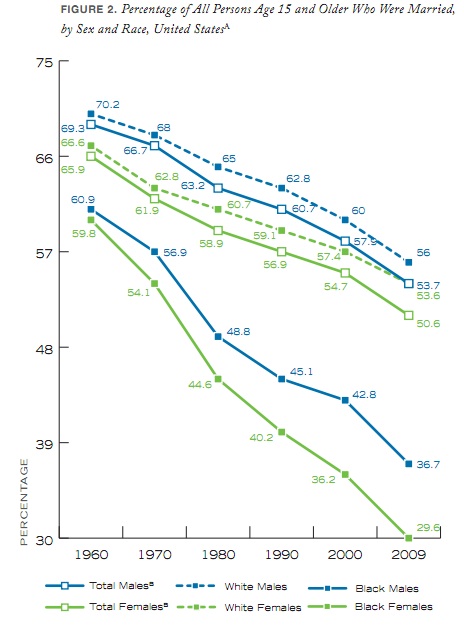
I looked through the full 2010 The State of Our Unions report. This graph, showing the percent of those aged 15 or older who were married from 1960-2009, shows that marriage has become less common for both men and women, Blacks and Whites (based on U.S. Census Data):
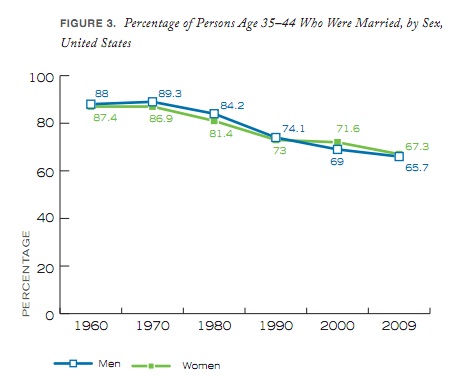
Of course, this is in large part because people in the U.S. are getting married later; not only do we not really expect a 15-year-old to be married, we’d be rather horrified if they were. If we look only at adults aged 35-44, we do see a significant decrease in marriage between 1960 and 2009, but still, about 2/3 were married:
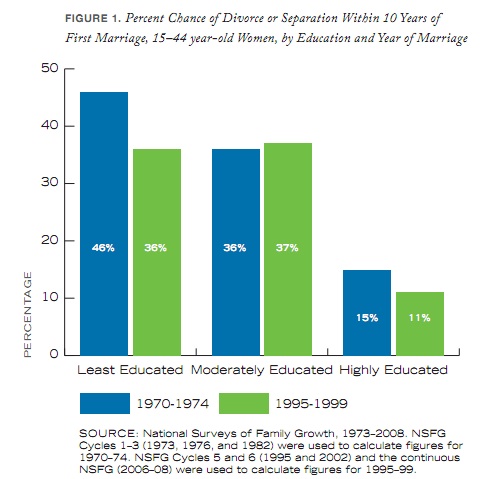
The report also includes a graph of the percent chance that a couple will divorce or separate within 10 years, broken down by education, for the early ’70s and the late ’90s (for first-marriage couples only). Least educated is defined as having less than a high school diploma; the moderately educated graduated high school but have less than a 4-year college degree; and the highly educated have a 4-year college degree or more:
Note that for both the least and most educated, the risk of divorce actually went down — though those with the least education are over three times as likely to separate/divorce than the highly educated.
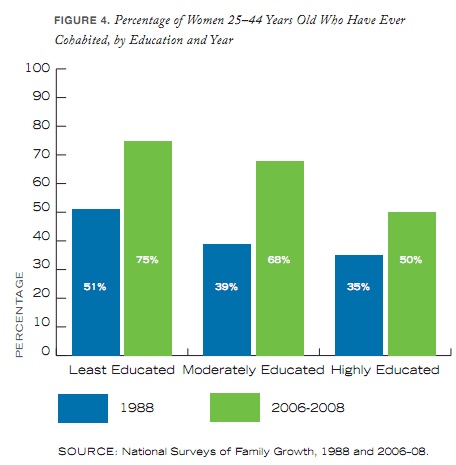
On the other hand, rates of cohabitation have gone up:
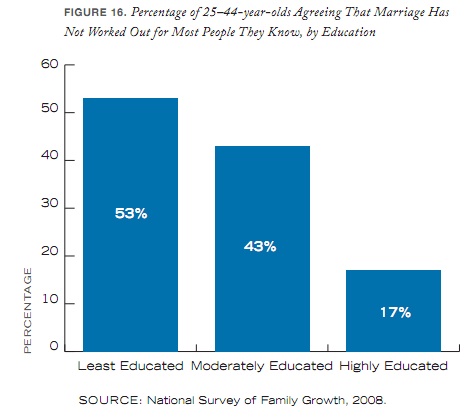
Perceptions of marriage, not surprisingly, also vary by educational level, with the highly educated feeling significantly more positively about marriage than the less educated population. Asked if they agreed that marriage hadn’t worked out for “most people” they know, 53% of the least educated and 43% of the moderately educated said yes, while only 17% of those with at least college degrees felt similarly:
So the overall trend appears to be a growing gap between the highly educated and those with less than a 4-year college degree, with the moderately educated looking more similar to those with less than a high school diploma in terms of their marriage, divorce, and cohabitation behaviors. If you’re interested in this topic, check out the full report.

Comments 13
:] — May 29, 2011
Good work, Martin Luther. Your agenda has finally reared his ugly head.
Beccy — May 29, 2011
The design of the top graph, though nice to look at, bugs me. Look how small it makes 2009's 50% to 1960's 65.9%. Even if the number had virtually not changed you could still get an impression it was dramatically reducing as time past. Anyone else bothered by this?
Mantis Toboggan, MD — May 29, 2011
"not only do we not really expect a 15-year-old to be married, we’d be rather horrified if they were"
Perhaps we should be a little bit more horrified at the 15 y/o that ISN'T married, but has 2 kids out of wedlock anyways. Unfortunately, we accept this type of behavior and continue to marginalize the institution of marriage.
I wish this article showed a little bit more on the implications of this data: that children from a two parent household do better (financially, educationally, emotionally, etc.), on average, than those from single parent homes. This data is basically saying that were robbing our children of a better future.
Unfotunately, too many states and courts are going around the constitution and legalizing same-sex marriage, ruining this sacred institution, and thereby ruining our children's future, and society as a whole.
eeka — May 29, 2011
I forgot for a second that there are more women than men, and saw that more men are married than women and was thinking, awesome, all the guys are getting married to each other!
(Seriously though, that site doesn't show in any sort of easily-findable way which marriages they're counting.)
Meera — May 29, 2011
Unless I'm misunderstanding how the figures for these graphs were arrived at, the data is also misleading because, over the last several decades, ages *within* these categories (15 and over, 25 to 40, etc) have increasingly skewed older as the baby-boomers aged and average-children-per-woman dropped. So, even if no change in the rate of marriage practices for people of a given age had occurred (though, of course, they did), the data would still show a shift over time, because women of, say, age 40 have always been more likely to be married than those of, for example, age 15.
Robert B. Pettit — May 29, 2011
The National Marriage Project is hardly an unbiased research organization. See, for example, this critique of their work and orientation: http://www.unmarried.org/marriage-only-forces-don-t-help.html
Marriage and Education | Times & Seasons — May 29, 2011
[...] (Source for graph.) [...]
Love and marriage, love and marriage... - Empty Closets - A safe online community for gay, lesbian, bisexual, transgendered people coming out — May 30, 2011
[...] [...]
Ashley — April 9, 2020
I believe that marriage rate decreases also because of the time and money which takes a couple to get married. Most of my friends don't want a marriage because of the wedding cost. Some of them don't want to start a family because they realize that it's not their life asset. However, divorces become much more popular and really easier. For example getting a divorce in california can be done without lawyer, if we mention uncontested cases. That really simplifies the divorce procedure and diy divorce is usually cheaper. But maybe it's for the better, who knows?