
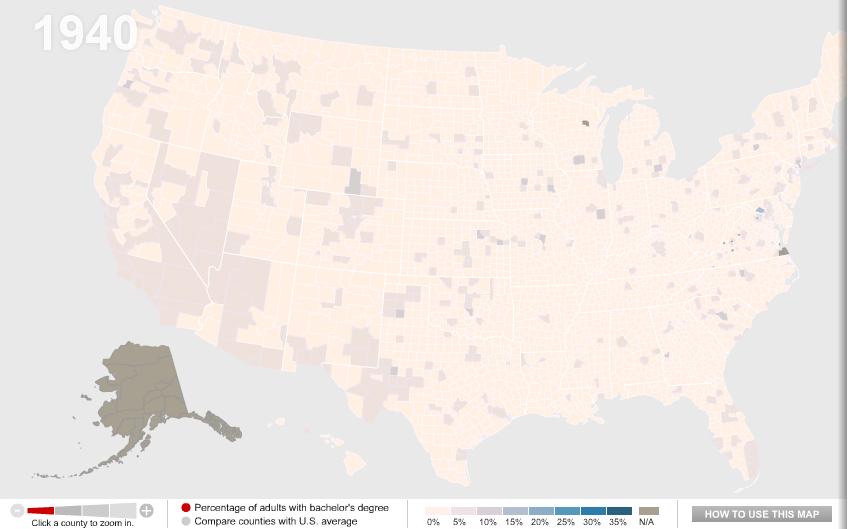
One of my colleagues, Kate Hahn, sent me a link to an interactive map at The Chronicle of Higher Education website that presents data on the proportion of U.S. adults with a bachelor’s degree over time. In 1940, in the vast majority of counties no more than 10% of the population had graduated from college (the national average was 4.6%):
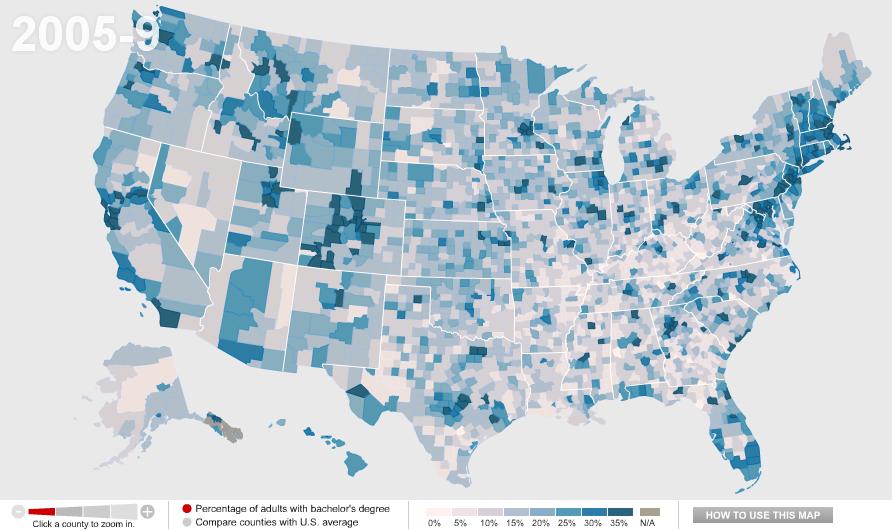
Now the national average is 27.5%:
You can also compare counties to the national average. Green counties are above the national average, brown ones are below and, not surprisingly, we see clear regional variations in rates of college education, with Colorado and the Northeast doing particularly well and the South and Appalachian regions lagging:
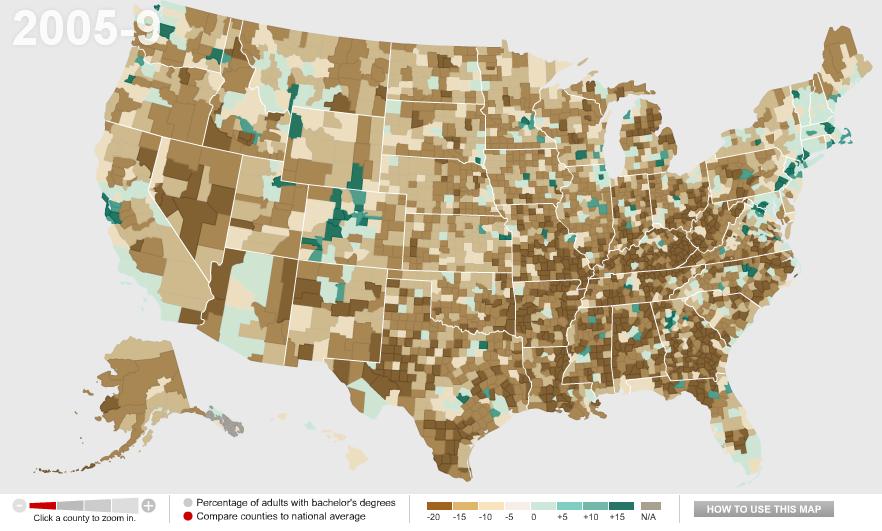
Wealthy counties (those with a median income of $60,000+) in general have higher than average rates of bachelor’s degrees, with the exception of a few counties in the Mountain West, Alaska, and a few scattered areas:

We see the opposite with poor counties (median income under $30,000):

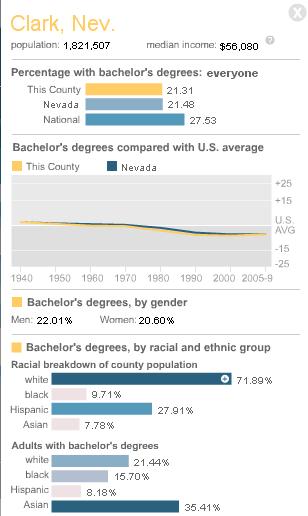
You can break down any of the comparisons by sex or race/ethnicity, and/or look only at counties with 20% or more Hispanic or Black residents. You can also select a particular county for more detailed information. For instance, here’s the info on Clark County, Nevada, where I live:
By comparing the maps over time, you can easily track a number of changes: the increase in college degrees overall, of course, but also changes in education such as the dramatic gains women have made in earning college degrees in the past few decades — the gender gap in college degrees was over 7 percentage points in 1980 but only about 1.5 points today.
Comments 12
Anonymous — March 3, 2011
This leaves out in-state graduation rates. Colorado is 49th in higher education funding and 47th in graduation rates. The educated are basically imported. It's called the Colorado Paradox:
http://www.aspentimes.com/article/20080929/NEWS/809299987/1077&ParentProfile=1058&title=At%20college%20fair,%20Ritter%20calls%20for%20an%20end%20to%20‘Colorado%20paradox’
Sorry for the long URL
Amadi — March 3, 2011
I would love to see this data overlain on an electoral map or two.
Che — March 3, 2011
It's interesting to see this - I grew up in Tennessee, went to grad school in California, and now live in New England. I had the impression that the northeast is the "most educated" place I've lived, but I wasn't sure if that was generally true or was just my impression from living in the Dartmouth area. I'd be curious to know whether, as anonymous says about Colorado, the "most educated" are native New Englanders or immigrants.
larrycwilson — March 3, 2011
The more individuals who have a BA/BS the more useless it will be.
Ted — March 3, 2011
What's really interesting about the first map is how clearly the I-95 corridor stands out, you can really see the difference between counties in states. And it really hits every city there, Richmond, to DC, to Baltimore, ducking through northern Delaware, into Philadelphia, then up through New Jersey to New York and Boston. Very interesting.