
Andrew over at FiveThirtyEight posted three maps that show which candidate would have carried each state if only members of one social class voted (in case it’s not obvious, blue = Obama and red = McCain):
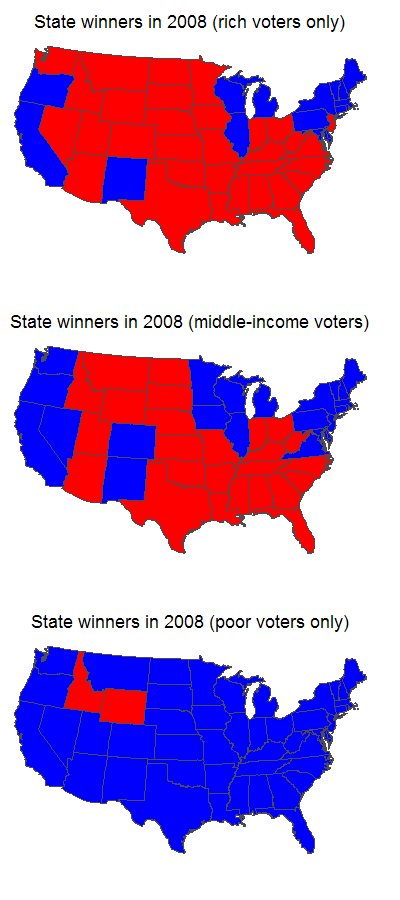
For the purposes of the estimate, “rich” was defined as a household income of $150,000+, “middle-income” was $40,000-75,000, and “poor” was $0-20,000. [Note: for the point of illustration, he just made maps showing the lowest, middle, and upper 20% of households by income, which is why the groups between $20,000-39,000 and $76,000-150,000 don’t show up here–he just made the 3 maps to illustrate the point.]
So what we seem to see here is that poor voters were more consistently partisan than rich voters, at least in the 2008 election. Whether this is a general pattern or something unique to 2008 I don’t know.
Comments 6
Sabriel — March 9, 2009
So were the voting patterns of people who make 20-40k and 75-150k just not included? That's a lot of people, right there.
Gwen Sharp, PhD — March 9, 2009
He just made maps showing the lowest, middle, and upper 20% of households by income, which is why the groups between $20,000-39,000 and $76,000-150,000 don't show up here--he just made the 3 maps to illustrate the point.
Anonymous Coward — March 10, 2009
I love this site - but sometimes I pray for these kinds of stats for other nations.
Gwen — March 10, 2009
A.C.--we do put up international comparisons when we come across them, but given that we live in the U.S. and our culture tends to be fairly self-focused, we happen across those types of images less frequently and have to more actively search them out, so they just don't come up as frequently. I'll make an effort, though :)
Liberals the party of the super rich - Page 2 - US Message Board - Political Discussion Forum — February 27, 2012
[...] "rich" state. Republicans are distributed between the middle and upper income brackets. Here's a graph to kind of illustrate the above and shows voter preference based on income. Note that the [...]
US two-party dominance - Page 22 — November 22, 2014
[…] Re: US two-party dominance Income and 2008 Presidential Voting Patterns » Sociological Images […]