
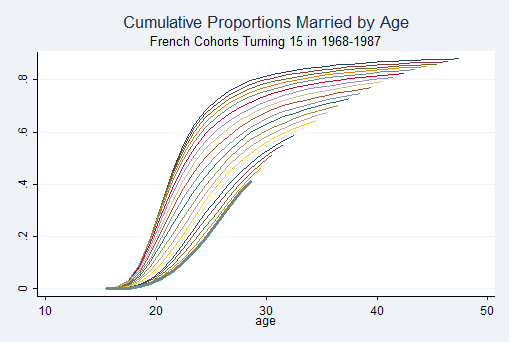
This graphic shows the age at which successive cohorts of French women are marrying. Along the bottom of the graphic, the thick grey line represents women who were age 15 in 1987 (the oldest at the end of data collection is a little less than 30, which is why the line stops). Each line above that represents an earlier cohort of women. The data shows that, while the earliest cohorts largely married in their early 20s, with just a few stragglers. The younger cohorts increasingly spread out the typical age of marriage. It takes nearly 15 years for the most recent cohort to have married off the same proportion of women that were married in the older cohort in the five years between 15 and 20.
This image was borrowed from a new Contexts blog called Graphic Sociology. Check it out.
Comments 1
poua — March 5, 2009
Im from iran..
merci for your web site
مرسی به خاطر وبسایت خوبتان
من زیادی نمی تونم انگلیسی حرف بزنم
sorry..