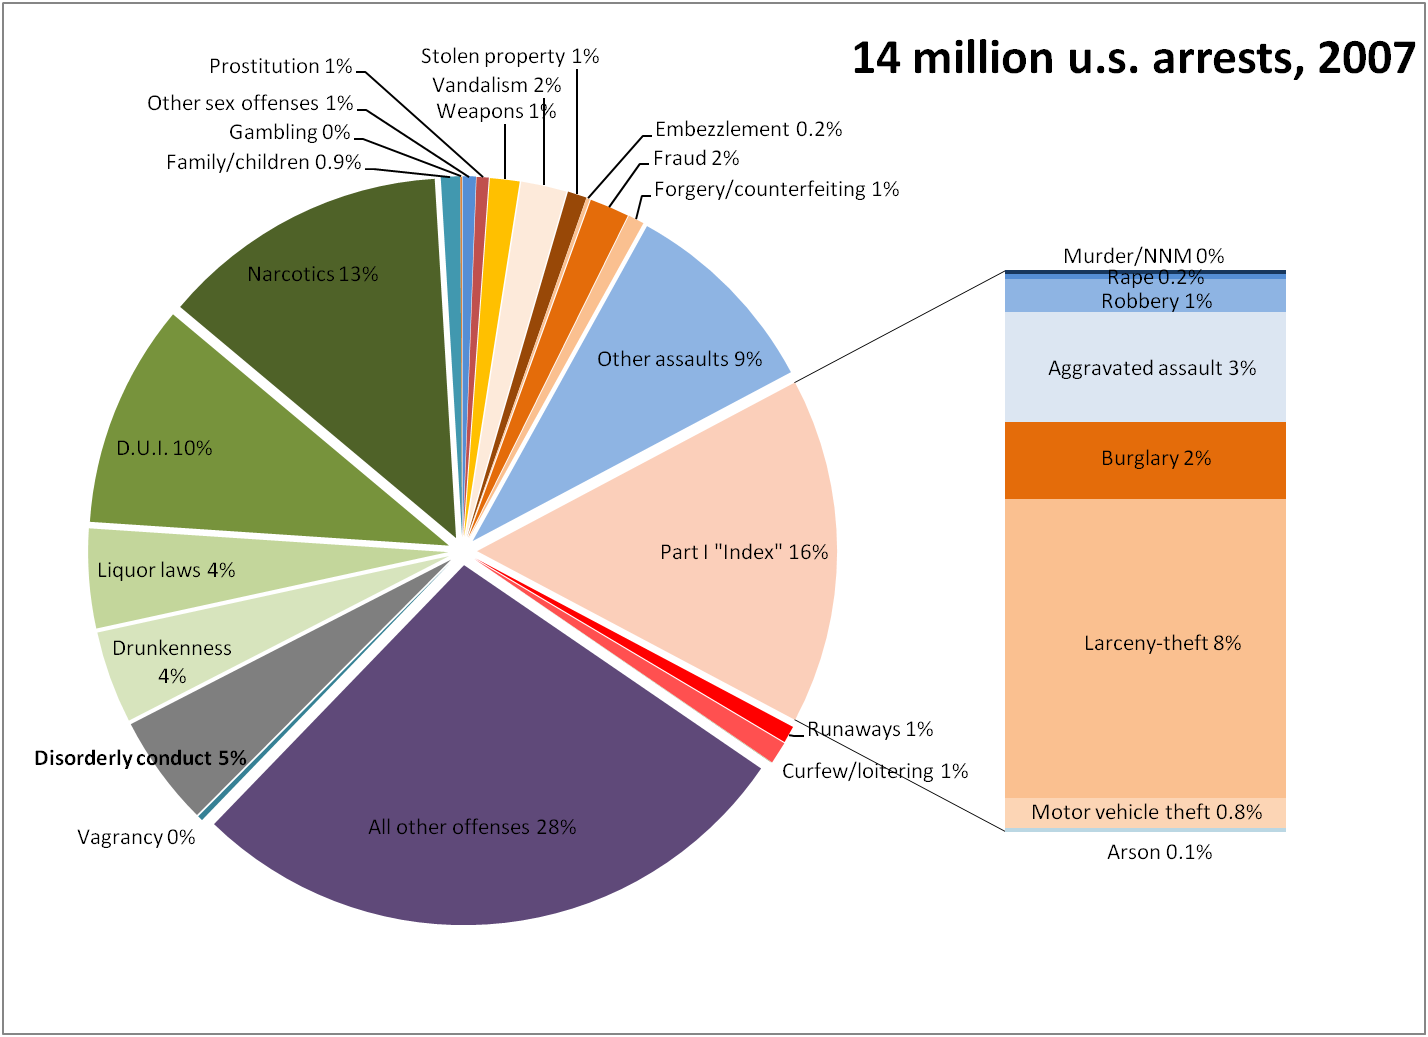
Chris Uggen put together a pie chart of U.S. arrests (FBI statistics 2007) in order to show that “only a small proportion of arrests involve violent crimes such as murder, rape, robbery, and aggravated assault” (see it here):
In 2007, only 4% of arrests were for violent crimes; another 12% were for crimes like burglary, theft, and arson; drug offenses (including drunkenness and DUIs) accounted for 31% of arrests.
Uggen mentions that he shows this data, in part, to talk about the way in which arrests for drug offenses disrupt families and neighborhoods. Low income neighborhoods are devastated by the transfer (to put it nicely) of huge numbers of adult males to jails and prisons. Those men are not overwhelmingly committing violent crimes (as stereotype suggest), but are imprisoned because of the intensive policing of drug crimes in those neighborhoods. In another post, we put up a table that showed how the “drug war” that started in the 1980s disproportionately affected blacks.
For more on crime and imprisonment, see this post on the ineffectiveness of racial profiling, this table on the percentage of children with parents in prison by race, and this table that compares incarceration rates across countries.


Comments 6
drewlower — January 22, 2009
It comes up often, ie. when discussing ethnicity/gender, but people's brains have the tendency to look to categorize. It's a basically adaptive cognitive trait that becomes problematic when such initial categorizations are over-adhered to, and we wind up with prejudice.
Of course, in sociology as with any method of discovery the answers one finds will be firmly grounded in the questions one asks and their methodology of choice (among other factors). This is to say, there's no truth but what we make it.
In any event, really I'm just blowing hot air to justify my silly reaction to the graph, as presented.
Giggle. The narcotics slice is green. Legalize!
So in sum: when you colorize a visual, you've gotta know that people will have the tendency to look for categories therein. And when someone sees that visual, and it has either been reproduced sans legend, or was simply colored for easy readability, then at least the silliest among viewers may become highly distracted and commit rambling posts to the internet about how distracting they found the presentation of the data, and also: pot joke.
OP Minded — January 22, 2009
"Low income neighborhoods are devastated by the transfer (to put it nicely) of huge numbers of adult males to jails and prisons."
I would argue, however, that the neighborhoods would likewise be devastated - although in a different way - if all those criminals remained on the street.
I think it is a White, privileged, fantasy which imagines that minorities and the working poor don't mind criminals walking the streets of their neighborhoods. (Of course, this is all a needless argument if folks just obeyed the law).
Matt K — January 22, 2009
OP Minded,
The question is whether particular acts should a. be illegal or b. warrant jail time, when jails really aren't effective deterrents and much drug "crimes" would be legal or possibly disappear entirely after legalization.
Tom — January 23, 2009
"drug offenses (including drunkenness and DUIs)"
I wouldn't lump together drug use and DUIs. One is a risk to yourself and the other is a potential risk to others. Pushing is a grey zone, I guess, depending on the substance involved.
Also, I think it's a White, privileged fantasy which imagines that minorities and the working poor get mostly arrested for profiting from the drug traffic. Most people get busted for possession.
The Agitator » Blog Archive » Morning Links — January 27, 2009
[...] Some interesting data on arrest statistics. Digg it | reddit | del.icio.us | Fark [...]
Race, Criminal Background, and Employment » Sociological Images — November 14, 2009
[...] of children with a parent in prison, by race, black/white disparities in prison sentences, the distribution of violent and non-violent crime, and how racial profiling doesn’t work. 4 Comments Tags: law/crime, [...]