
Many of you may have seen the image below. It compares the 2004 to the 2008 vote and shows, by color, how much more Democratic (blue) or Republican (red) each county leaned in 2008. In essence, compared to 2004, in this election Democrats increased the proportion of the vote that they received in most counties.
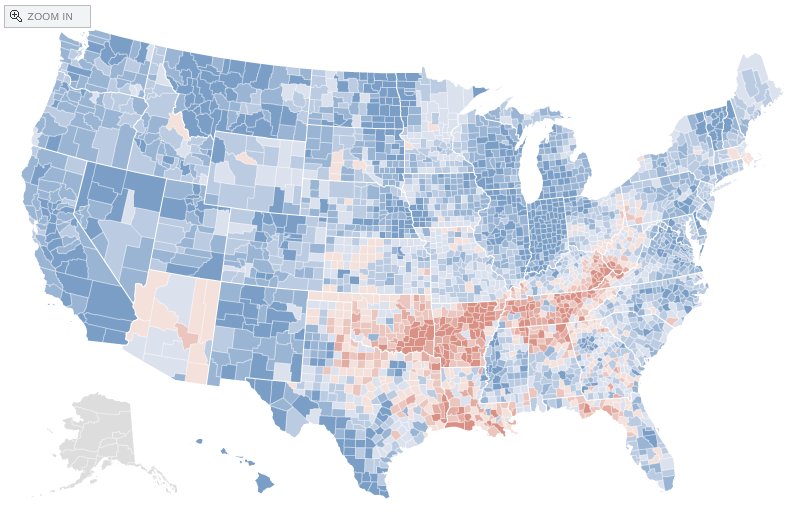
You may not have seen, however, this next image. This next image shows the same data but compares 1992 to 2008. Looking across those sixteen years it is clear that, while this last election may have looked good for Democrats, the last five have moved the country significantly to the right. If you are a Democrat, then, this election is one step forward after 10 steps back. And, if you are a Republican, it may very well be a very small setback.

(Data from the New York Times; images found here.)
Comments 9
Dusk_Blue — November 30, 2008
I am neither. I give it a "hmmm."
Breck — November 30, 2008
Great, now I'm depressed.
Chris — November 30, 2008
The source material has a scale, but the snapshots don't. This could be an intro to 'how to lie with statistics' if the scales are different on red vs. blue shift. Or worse, if the scales are 'normalized' so that the overall shift is grey -- you could have a red area that was actually more democratic, or vice versa. (This is NOT happening here, but I've seen it in other contexts.)
It's also highly misleading since it is based on surface area, not population. We don't choose presidents by acreage, we choose them by population. The maps would look very different if you use one where the area of each county reflects its population -- or better yet a map where the area of each county reflects the calculated number of voters that shifted one way to another.
Related to that is the fact that 16 years is a long time -- a lot of 1992 voters have died, some voters in 2008 were toddlers in 1992, people move. Again it's a kicking off point -- are the rural people who stay in rural areas more likely to be Republicans, the rural people who migrate into urban areas more likely to be Democrats? What about the converse, urban people who migrate in rural areas? What about the population in total -- are the rural counties losing population in absolute terms? (That is, maybe the population was 20,000 in 1992, but only 19,000 in 2008 even though the population of the nation as a while increased by tens of millions of people over the same period.)
Beyond that, it's mostly an example of how single numbers can be meaningless. 1992 was Clinton's win over Bush I and Perot. Many people think Bush would have won reelection if Perot had stayed out of the race. That makes 1992 an exceptional case and inappropriate for comparison. 1996 shows the same pattern and eliminates this problem, although to a much lesser extent.
Village Idiot — November 30, 2008
"If you are a Democrat, then, this election is one step forward after 10 steps back. And, if you are a Republican, it may very well be a very small setback."
I suppose, after 10 steps back, that the size of the Democrat's step forward is relevant in determining how much ground has been regained. This election was not like any other, and the fact that Obama won may point to a leap to the left more so than a mere step, but only time will tell. An analysis of these trends should consider the galvanizing effect that opening up a new era in American politics can have, though predicting where it might lead is anyone's guess.
I'm a radical centrist (or so I've been told); all I'm looking for is some balance, so a strong shift to the left is fine with me. But not too far...
Lisa Wade, PhD — November 30, 2008
Chris,
Thanks for the analysis!
Penny — November 30, 2008
"It’s also highly misleading since it is based on surface area, not population. We don’t choose presidents by acreage, we choose them by population. "
Bingo. Mapped statistics are fun to look at and can certainly be useful, but they're also misleading for just this reason. Big swaths of red aren't especially significant if they're covering places with more tumbleweeds than voters.
frances — November 30, 2008
I think the analysis of the 2nd image is particularly misleading. Yes, more of geographical area is red than blue. But the areas that are blue (most of New England, NYC and other major cities, CA coast, great lakes region, etc.) are much more highly populated than other areas of the country. As Chris said, looking at population might be more informative than looking at area. I suspect that the 2nd map represents about 50% population leaning more left and 50% leaning more right. In fact it looks an awful lot like the 2000 map of presidential election results, where the vote was more or less split between the parties.
If anything the second map shows the continuing geographical divide of the country into red and blue states/regions, with coasts and a few other areas becoming more Democratic and the middle of the country and the South becoming more conservative. There are a few states where red and blue counties are sprinkled throughout, but not many.
Barbar — November 30, 2008
Concur with the above commenters. In fact, the first graph is easy to understand because there is a basically a countrywide shift to the Democrats. The second graph conveys mixed information, which makes it much more difficult to interpret; you need to think about population density, etc. This makes it much less useful, and certainly nothing to get depressed about.
jeffrey — November 30, 2008
I have a slightly different analysis. I am less concerned with the data and its interpretation than I am with what can be interpreted from it. For instance, if we take the data at face value (which we may as well, since it has about as much truth value as you would see just about anywhere else in the media), perhaps this says less about a shift in voting trends from right to left (or Republican to Democrat, as you will), than it does about the possibility of a gradual shift and massive change over time as to what it means to people to be either Democrat or Republican.
The binary of Red/Blue, Republican/Democrat (and thus the above data) means very little if over the past sixteen years more and more people on the right have been able to vote Democrat because their message has changed dramatically since 1980.
In other words, while the messages of the respective parties have changed over the years, the red and blue tends to wash over people, while their own values remain static, applicable to whatever the newest political catch-phrase may be, and (perhaps more importantly) whichever party first claims it as its own.