
When I was in grade school, I remember having one of my first sociological “aha moments” during geography. We were starting a unit on Latin and South American countries and each of us had to draw a map showing the countries and capitals to show how much we already knew. We all had those school issued atlases of the world, but we had to draw the map of Latin and South America without using the atlas.
What I ended up with was similar to most kids at my table– a huge United States with a skinny little piece of land under it, just barely larger than Florida and then a larger piece of land under that about the size of Alaska. As elementary school kids in Maine we obviously knew very little about anything south of say, Washington D.C. and this was reflected in the little pieces of land we drew. I opened up my atlas and looked at how large Latin and South America really were and was shocked. It was nearly as large as Africa, and certainly larger than the the U.S.
How things are measured makes all the difference and cartography (map making) has a fascinating history in colonial empires and imperialism (charting “unknown” far off lands filled with “savages” etc.). So when SWS member Jeanne Flavin sent me a link to the ODT Maps website I had to share some of them here.
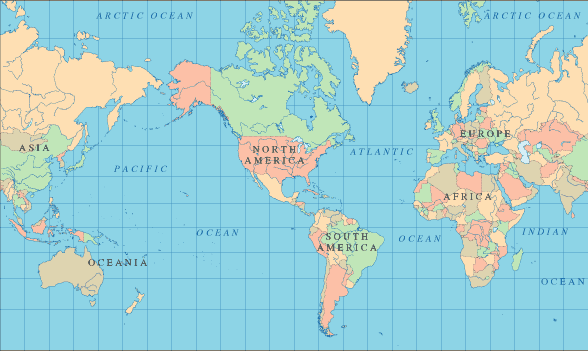
Let’s start with a pretty “typical” North America-centered map of the world–
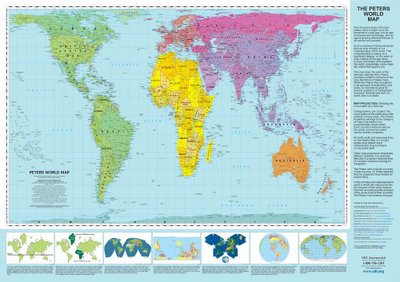
Now how about this equal area ODT map?
 © www.ODTmaps.com
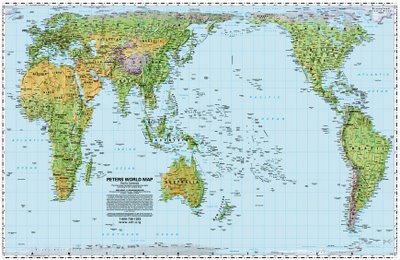
And how about an actual equal area Pacific-centered map from ODT?
 © www.ODTmaps.com
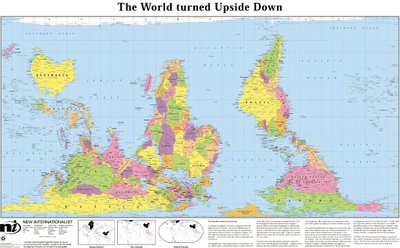
And how about this South-up map, challenging North-South perceptions (how do we know which end of the world is “up” anyway– who decides that?).
 © www.ODTmaps.com
And my favorite– the population map.

There are more maps and resources for the classroom on the ODT website. Thanks Jeanne!
Comments 4
Anonymous — February 20, 2008
Fascinating.
radiogirl — February 20, 2008
Very intriguing!
73man — April 15, 2008
Slightly different but have you seen: www.worldmapper.org?
John — January 27, 2026
good to go. edistrict