
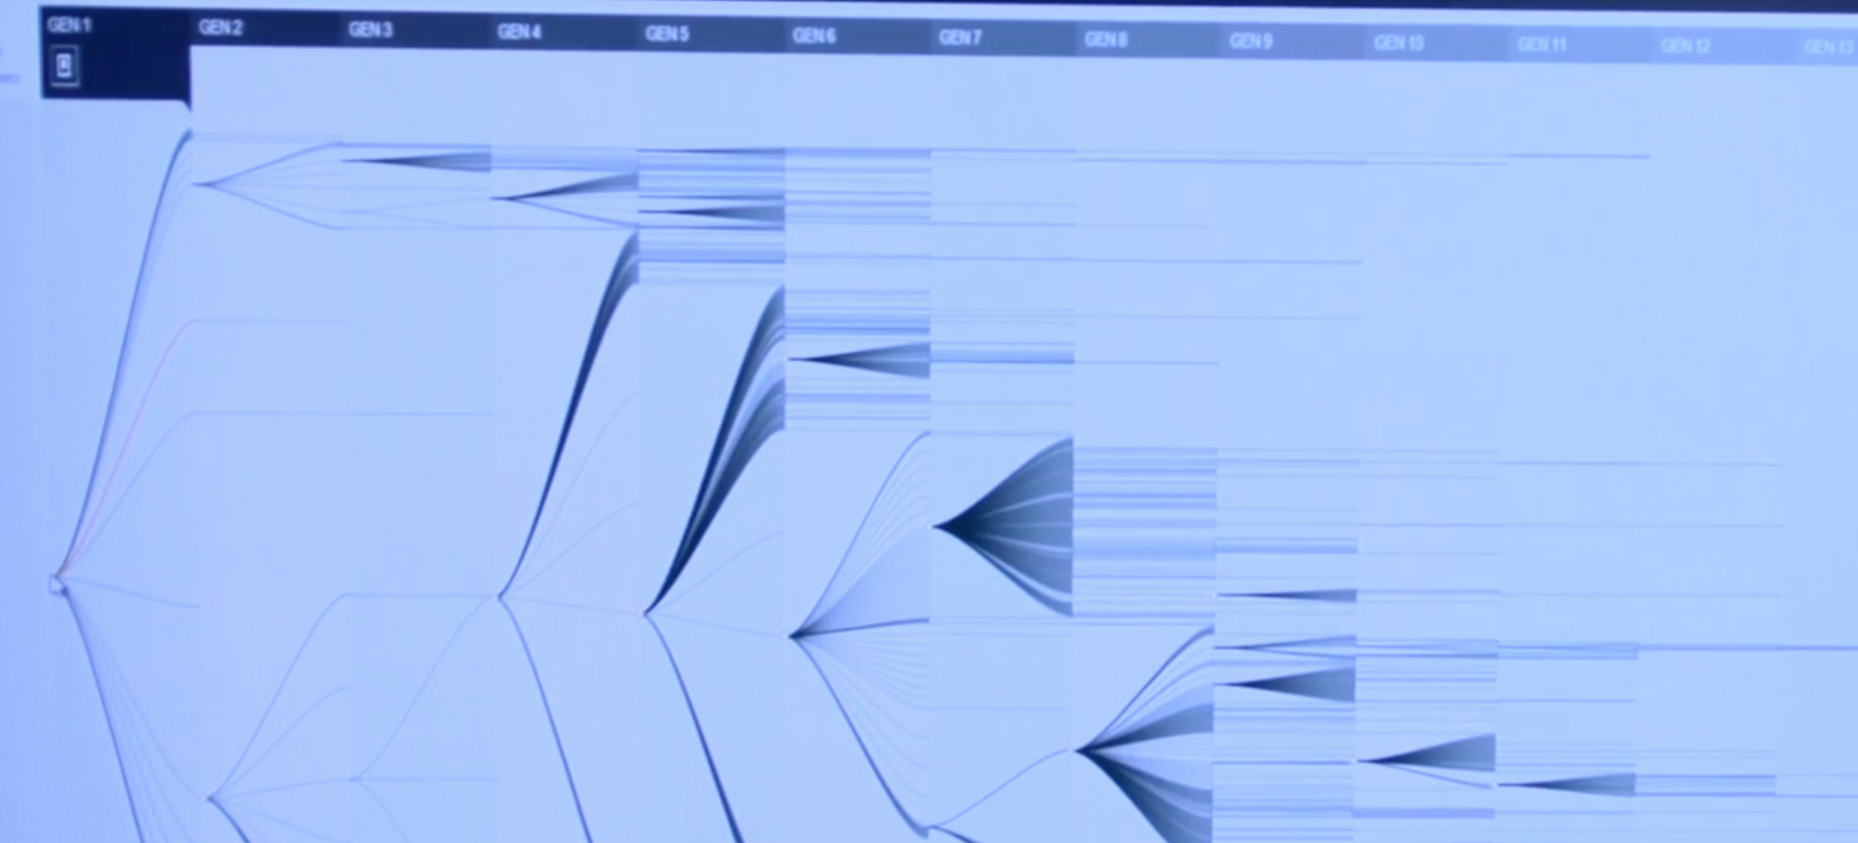
In March 2013, at Microsoft’s annual research and development event TechFest, a new project was introduced that aimed to let “users interactively explore the full chain of events whereby individual news stories, videos, images, and petitions spread from one user to the next over a social network.” The program, in effect, aims to understand how content spreads through a social network such as Twitter. By aggregating large amounts of data and tracking how users share things on their Twitter accounts, ViralSearch turns the transmission of content into a visually friendly genealogy of media, which Microsoft terms its “virality.” The more descendants a video has, for example, meaning those who have shared it (which is broken up into generations, or subsets of users that represent one wave of shares) the more viral it is according to ViralSearch’s virality percentage. More than this, it actively differentiates between virality and popularity, by looking precisely at how the information is shared. As researcher Jake Hofman says,
This is what people sort of typically have in their mind when they think about one of these viral videos, but nobody’s really been able to actually look at the structure of these things to date. And so what we’re able to do is going through these billions of events we reconstruct these trees by looking at all the followers of everyone who adopts the content and using a large cluster to reconstruct these things and then a novel scoring method to actually distinguish this tree as being viral from just being popular.
The example given by Hofman is of a story shared by the official Forbes Twitter account, which reached a wide number of people, who then shared that story, but failed to be shared beyond that “first generation” of users. In contrast, Hofman pulls up the visualization of a cover of a Gotye song, which according to the parameters of ViralSearch is more viral because of how many successive generations it has gone through and the multitude of users who have shared it throughout those generations. In essence, ViralSearch wields content as contagion, and quantifies precisely how contagious it is and who it has spread to. ViralSearch recognizes how things have “become viral in the sense that they’ve been passed on from one person to the next over many generations.”
Though it debuted in March 2013, ViralSearch has yet to be made public, but is instead being used internally by Microsoft. It does, however, represent one of many data tools aimed at mapping content transmission, with BuzzFeed’s Viral Dashboard and Facebook’s Page Insights being two other examples of social media analytics that are available to the public. The prevalence of these analytic mechanisms seems to indicate an increased engagement with not only recognizing how media is circulated online, but with exploiting those pathways as well. The management of digital information, via ViralSearch or otherwise, demonstrates the power implicit in the very act of mapping, by which indices of “virality” configure who sees what and when. One can also see the possible profits in capitalizing on a “highly viral” user and the reproducibility of their posts. This is not, however, a disaggregation on my part of the digital from the organic, (I am not interested in saying Facebook posts represent a wholly unique mechanism of content/desire production) but rather I want to move towards a recalibration of the relationship between online networks and fleshy human bodies. Both are constituted in similar epistemological and ethical processes. Perhaps, however, the cyborg is not the liberatory figure that Haraway envisioned, but merely the latest iteration of normative and therefore privileged human being, a new literacy for the present moment. To be connected, to be part of the viral web, is in most circumstances to have a privileged form of access. And yet, it is important to differentiate between mapmakers and those being mapped.
To this, Daniel Smith asks, “why do we have such a stake in investing in a social system that constantly represses us, thwarts our interests, and introduces lack into our lives? In the end, the answer is simple: it is because your desire—that is, your drives and affects—are not your own, so to speak.” The viral geographies of ViralSearch are each assemblages of manufactured desire. Their productive affects are crucial not only to the system itself, aggrandizing trends towards Microsoft’s bottom line, but also towards a biopolitics constitutive of a normative (post)human subject, against which ‘deviant’ bodies, whether human, animal, viral, or digital, are carefully measured. ViralSearch is indicative of an ethics that disregards access in favor of universalized responsibility, in which a supposedly level playing field emerges out of the ‘egalitarian’ architecture of the viral.
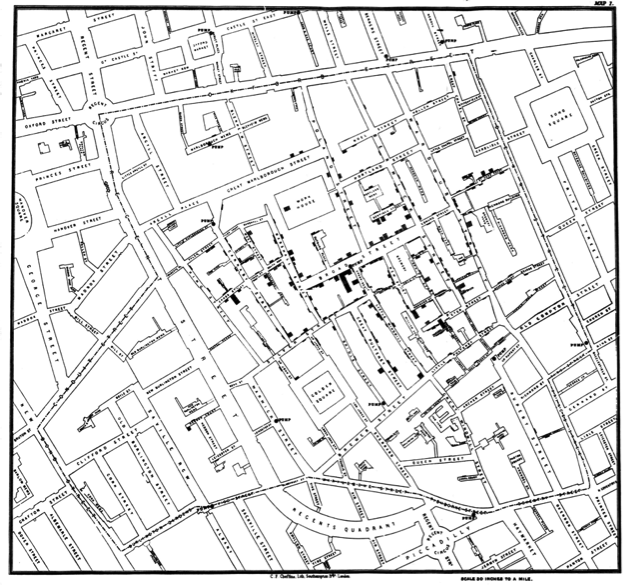
To these ends, ViralSearch works epidemiologically, as a technic that allows Microsoft to “understand” particular media contagions and exploit them. In September 1854 in London, England a different kind of contagion was being mapped. John Snow, a local physician was caught in the midst of a horrific cholera outbreak, which killed over 600 people in a matter of days. Snow doubted the common conception of the disease at the time, having been witness to several other cholera outbreaks, that it was caused by “miasmas” or poor quality gasses emanating from sites of decay such as sewers, graves, and garbage pits. Instead, Snow theorized that the unsanitary condition of the local drinking water was at fault by locating the incidents of cholera and mapping them. In doing so, and after interviewing residents who both lived in and around the affected areas, Snow was able to pinpoint the problem as the local well at Broad Street. With the help of a neighborhood reverend, Snow convinced the authorities to remove the pump handle to the well and the outbreak subsided soon thereafter. Following his death, Snow’s work on disease statistics and mapping was celebrated as an inaugural moment modern epidemiology.
Why include a conversation on a 19th Century cholera outbreak in an essay on viral geography? For one, I believe the management of digital and organic contagions to have a remarkable level of overlap, both in terms of treatment and how they are visualized. In the field of medical epidemiology services like HealthMap.org aggregate data from Google Trends, Google Flu Trends, the CDC, media sources, eyewitness accounts, and the WHO, to map the spread of particular diseases. The website uses Google Maps API to show a historical timeline of disease outbreak and to quantify just how many cases are being reported. Funded by US government sources such as IARPA, DTRA, and the CDC, as well as by companies like Google, Unilever, Merck, Amazon, and Twitter, HealthMap.org has been run by the Boston Children’s Hospital since it was founded in 2006. With its corresponding ‘Outbreaks Near Me’ app,
HealthMap brings together disparate data sources, including online news aggregators, eyewitness reports, expert-curated discussions and validated official reports, to achieve a unified and comprehensive view of the current global state of infectious diseases and their effect on human and animal health. Through an automated process, updating 24/7/365, the system monitors, organizes, integrates, filters, visualizes and disseminates online information about emerging diseases in nine languages, facilitating early detection of global public health threats.
In contrast to ViralSearch, which seeks to locate and promote viral media to benefit Microsoft (and whoever else the software is eventually marketed to), HealthMap uses similar mechanisms of data aggregation as a preventative to the spread of global contagion. HealthMap, through its own stated intentions, seems to be continuing the work of John Snow, mapping infection onto localized areas and making people aware of disease hotspots. In digging deeper, however, one can begin to see the truly troubling aspects of each program.
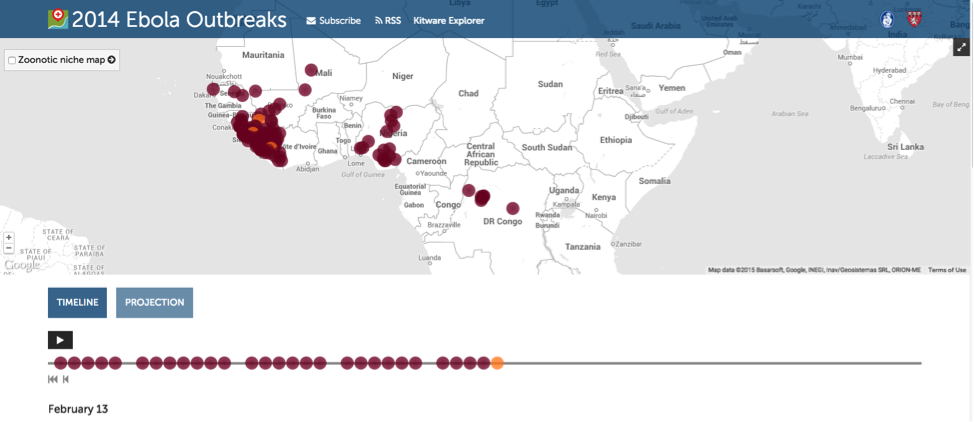
HealthMap marks, with a colored gradient scale from yellow (low) to purple (high), activity of a given, or of all, diseases on a worldwide map. In the absence of user ratings, “the system assigns a composite score based on the disease importance and the news volume associated with the alert. If a location’s marker has multiple alerts, the color associated with the most prominent alert is used.” The aggregation of viral activity in HealthMap operates via user reports, news volume, and perceived disease importance. HealthMap, therefore, represents an explicit means of marking particular locales as sites of disease, as the 2014 Ebola outbreak image demonstrates. Alongside stories like this New York Times article describing a “hospital from hell” in Sierra Leone, the virality of HealthMap evidences a dual mobilization of contagion. It both wields and incites user interaction towards its own aggrandizement. The heinous implication is that when the viral operates only as a quantified object the effects of its dissemination are obscured. Projections of where Ebola might strike next, (or more recently Zika) incite a kind of paranoia that only heightens nationalist anxieties (not to mention the long genealogy of hygiene and racialization). No algorithm is perfect, and the predictive visualizations of HealthMap are a definite cause for concern. More than this, as its sponsors indicate, HealthMap, represents yet another iteration of data mining under the guise of being in service of the public good. It wields a viral geography that privileges corporate access to data over its real world effects, algorithmically marking bodies as diseased, or vulnerable in their potential proximity to those diseased bodies.
Viral geography, therefore, is never simply an objective endeavor devoid of bias, intent, or cooptation. It is instead formative to how we imagine particular spaces, how we relate to them, and the highly politicized ways in which that information is utilized. Perhaps, then, we should reorient the epidemiological model that HealthMap and ViralSearch present us with, opting against purity, exploitation, and extraction in favor of subversive viralities that infect those institutions themselves.