

The following is a re-post in honor of the (2014) 50th Anniversary of the Civil Rights Act.
Catholic and Jewish Americans since The Civil Rights Era
The Civil Rights Act of 1964 not only ushered in stronger federal protections for racial and ethnic minorities and women, but also for religious minorities. Antipathy toward Catholics and Jews in the US was a persistent and prevalent theme through much of American history. It was common for these groups to be labeled “un-American” and even categorized as “non-white.” Members of these religions were often discriminated against in hiring and in admission to institutions of higher learning (this was especially common for Jewish applicants) and excluded from many neighborhoods, clubs, and political positions. From the late 19th through the mid-20th century, organized hate groups, most notably the Ku Klux Klan, used the threat of violence to intimidate not only African-Americans but Jews and Catholics as well.
After World War II, these restrictions and prejudices eased somewhat. By 1955 the now-classic essay Protestant Catholic Jew could proclaim that although these three religions were the primary sources of identity in America, they were now “alternative ways of being an American” rather than two of them being seen as Un-American.
Still, anti-Semitism and anti-Catholicism persisted. In the 1960s, some commentators worried that President Kennedy, a Catholic, would take orders from the Pope. In the 1970s, President Richard Nixon was recorded making several anti-Semitic comments. And even today nativist hate groups continue to perpetuate centuries-old hostilities against Catholic and Jewish Americans. But the Civil Rights Act did give these minorities protection against outright exclusion and discrimination, and other religious minorities have also looked to it for security as the American religious landscape has diversified.American Religious Belonging Today
Religion scholars consider the United States to be an anomaly on the modern religious scene. Compared to other nations at similar levels of modernization, the United States stands out as highly religious. For example, in Western Europe about three-quarters of the population profess a belief in a God or higher power (with this proportion significantly lower in some individual nations). In America, by contrast, 90 percent of adults profess such a belief. These American numbers have remained fairly stable, with only small long-term declines, over the past fifty years.
However, one major measure of religiosity has changed significantly over that time period: religious belonging, or identifying with a particular religion rather than simply holding religious beliefs.
Currently 80 percent of the U.S. adult population identifies as belonging to one of the 3,500 groups that make up the American religious landscape. Religion scholars categorize these groups in different ways, but one of the most popular classifications divides them into six major American religious traditions: Evangelical Protestants, Mainline Protestants, Black Protestants, Catholics, Jews, and Other Religions. Twenty percent of Americans fall into a seventh category, which sociologists call the ‘religious Nones’ – those who identify with no religious tradition even if they do believe in God or a higher being.
The distribution of Americans among these various groups has fluctuated and changed over the past 50 years. Figure 1 shows these trends in affiliation from 1957-1971 using Gallup polling data and from 1972-2012 using data from the General Social Survey (GSS).
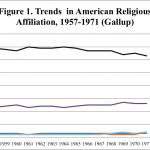
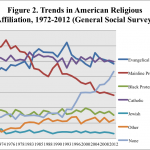
We draw attention to six specific trends:
- The Protestant share of the American population has shrunk from more than 70 percent of the population in the late 1950s to less than 50 percent today. This is primarily due to the precipitous decline of Mainline Protestants (e.g. Methodists, Lutheran and Episcopalians), from more than 30 percent of the U.S. population in the 1970’s to around 15 percent today.
- Evangelical Protestants (e.g. Baptists, Pentecostals) have increased their representation in the population from less than a quarter of the population in the 1960s to 31 percent in the early 1990s. However, this was the period of their peak membership. Contrary to popular impression, their share of the religious market has since declined to 24 percent.
- Catholics have sustained their share of the religious market, remaining at approximately 25 percent throughout the latter half of the 20th century. But this is primarily due to the influx of Latino immigrants to the United States. The share of native born (primarily white) Catholics has declined.
- Despite the large percentage of Americans who profess a belief in a higher power, there has been a recent meteoric rise of the religious Nones, from about 3 percent of the population in the mid-20th century, to 10 percent in 2000, to 20 percent today. One in every 5 Americans does not identify with a particular religious tradition.
- The proportion of Americans who identify with “Other” religious traditions has doubled, an increase that is closely tied to the increased immigration of Asian populations who brought non-western religions (e.g. Buddhism, Hinduism, Islam) with them. While still a small proportion of the overall population, they contribute greatly to the increased religious diversity of the American religious landscape. In 20 states,scattered in the Midwest and South, Islam is the largest non-Christian religion. Judaism is the largest non-Christian religion in 15 states, mostly in the Northeast, and Buddhism is the largest religion in 13 western states. In Delaware and Arizona, Hinduism is the largest non-Christian religion, while in South Carolina it is the Baha’i. For more details visit here.
- According to the Pew Research Centers, “the percentage of US adults who say they are Jewish when asked about their religion has declined by about half since the late 1950s.” It is currently is a little less than two percent.
Religion and Socio-Economic Status
Religious groups differ not only in their beliefs but in their place in the socioeconomic and educational hierarchy. Some groups have been upwardly mobile during this time period while others have experienced more limited progress.- In the 19th century, white Catholics, especially Irish immigrants, were over-represented among the poor. But in the 20th century, especially since the 1960s, white Catholics have experienced unprecedented upward mobility. They now closely resemble Mainline Protestants on socioeconomic measures, with a median net worth of $156,000 compared to Mainline Protestant’s $146,000. Latino Catholics, by contrast, have a net worth of $51,500, substantially below their white Catholic counterparts. White Catholics have also spent more time in school (14 years on average) than their Latino counterparts (12.5 years).
- Jews have the highest median net worth of any U.S. religious tradition, at $423,500, Black Protestants have the lowest, at around $22,800. On average, Jews have 16 years of education while Black Protestants have 12.7 years of education.
- Evangelical Protestants remain near the bottom of the economic ladder with a median net worth of $82,400. They average 13.2 years of education, above Latino Catholics but below the national average.
- The Non-Affiliated (or religious Nones) are also below the U.S. median net worth and median education level, with a median of only 12.7 years of education. Less than 10 percent of this group holds an advanced degree. Only Black Protestants and Hispanic Catholics have lower levels of educational attainment than “Nones.”
Religion and Union Formation and Dissolution
 Religion is popularly thought of as a social institution that encourages marriage and family growth, and conservative religious traditions are especially supportive of “traditional” family forms and values. But there are some interesting and not always predictable variations among and within different religious groups.
- Cohabitation is now the most common path toward marriage, and it is on the rise among religious groups as well. But non–affiliated young people are the most likely group to cohabit. Overall Catholics are the least likely to cohabit. Across all religious traditions, teens who attend religious worship services more often and say that religion is more important to them are less likely to cohabit than less observant teens.
- Overall, couples who have higher levels of religious service attendance, especially if the couple attends together, have lower rates of divorce. But there are big variations among religious groups. White Catholics and Mainline Protestants are less likely than the average American to be divorced, with 12.4 percent and 12.5 percent of their populations being currently divorced, respectively, compared to an overall average of 14.2 of Americans currently divorced.
- But white Conservative Protestants and Black Protestants are more likely than the average American to be divorced, with 17.2 percent and 15.7 percent of their populations being currently divorced, respectively. Indeed, Evangelical Protestants are more likely to be divorced than Americans who claim no religion.
Thus the common conservative argument that strong religion leads to strong families does not hold up. Some have argued that evangelical Protestantism (the typical example of “strong religion”) is correlated with low socioeconomic status, and that this explains the increased risk of divorce. However, new research by Jennifer Glass and Philip Levchak suggests that evangelical Protestants’ cultural encouragement of early marriage and discouragement of birth control and higher education attainment explain the higher divorce rate in counties with a larger proportion of evangelical Protestants. In fact, living in such counties increases the likelihood of divorce for all couples, regardless of whether they themselves are evangelicals.
Religion and Fertility
The most dependable way for religious groups to maintain or grow their membership is through sexual reproduction. Differences in fertility rates among religious groups are a large part of this story.
- On average, women from Evangelical Protestant traditions have one more child over their lifetime than their mainline Protestant counterparts. In fact, it is estimated that the fertility practices of evangelical women explain more than 75 percent of the growth these groups have experienced over time.
- Fertility rates among religious groups vary considerably, generally correlating with their social fortunes over time. Lower SES religious groups (who also more highly value and encourage childbearing) tend to have higher fertility rates. As groups become upwardly mobile, increasing in educational and income attainment, fertility tends to decline. For example, fertility among American White Catholics has dropped slightly below replacement rates (approximately 2.1 children per woman is considered replacement fertility) as they became upwardly mobile. But the rapid growth of new immigrant (post 1964) Latino Catholics has offset this decline. Today, Latino Catholics have fertility rates above replacement, upholding the Catholic share of the American adult population at a steady twenty-five percent. It is possible that these fertility rates will fall as immigrants live longer in the U.S.
Religious Switching

The ability of religions to retain the affiliation of individuals as they age is another key to maintaining or growing their share of the United States population. Nearly three-quarters of American adults have the same religious affiliation as their parents, but this means that more than a quarter of American adults have left the religious tradition in which they were raised.
- The most common path for young adults leading away from the religion of their childhood is non-affiliation. This is starkly illustrated by the divergent fortunes of the Mainline Protestants and religious Nones, whose trend lines pass each other somewhere around 2004 (see Figure 1). Overall, Catholics and Evangelical Protestants are somewhat better at retention than Mainline Protestants, who see a third of each generation leave the tradition.
- Latino Catholics are twice as likely as White Catholics to remain Catholic as they age, another way in which this subpopulation has upheld the Catholic share of the American religious market.
- In the past it was common for young people who grew up with no religious affiliation to join a religious tradition as they transitioned into adulthood. Today, by contrast, most youths raised as religious Nones remain so as they age.
- No matter what the religious tradition, the greatest predictor of whether a person switches at some point in the life is whether or not their parents match each other religiously. This leads to another dimension of religion and family: the marriage of individuals of different religious faiths, described in the McClendon’s “Interfaith Marriage and Romantic Unions in the United States” briefing report in this Council on Contemporary Families Civil Rights Symposium.
Conclusion
Since the passage of the Civil Rights Act of 1964, religious minorities, particularly Catholic and Jewish Americans, have gained greater acceptance as part of the American religious mainstream. At the same time, America’s religious landscape, like its racial-ethnic one, has diversified over the past half century. The many varieties of Protestants are part of an ever-expanding religious mosaic that includes Jews, Catholics and a growing presence of Buddhists, Hindus, Jains, Mormons, Muslims and Sikhs, along with increasing numbers of individuals whose spiritual beliefs are not anchored in any particular religious affiliation. Americans have certainly become more tolerant of a wide range of beliefs, but in this diverse environment the Civil Rights Act remains an important source of protection for religious (and non-religious) minorities.
References:
Chaves, Mark. 2011. American Religion: Contemporary Trends. Princeton University Press.
Chokshi, Niraj 2013. “Religion in America’s States and Counties in 6 Maps.” The Washington Post. http://www.washingtonpost.com/blogs/govbeat/wp/2013/12/12/religion-in-americas-states-and-counties-in-6-maps/
European Commision. 2010. “Special Eurobaromter: Biotechnology Report.” http://ec.europa.eu/public_opinion/archives/ebs/ebs_341_en.pdf
Glass, Jennifer and Philip Levchak 2014. “Red States, Blue States, and Divorce: Understanding Regional Variation in Divorce Rates.” American Journal of Sociology. Summary: http://www.contemporaryfamilies.org/impact-of-conservative-protestantism-on-regional-divorce-rates/
Hout, Michael, Andrew Greeley, and Melissa J. Wilde. 2001. “The Demographic Imperative in Religious Change in the United States.” American Journal of Sociology 107(2):468–500.
Keister, Lisa A. 2011. Faith and Money: How Religion Contributes to Wealth and Poverty. Cambridge University Press.
Mahoney, Annette. 2010. “Religion in Families, 1999–2009: A Relational Spirituality Framework.” Journal of Marriage and Family 72(4):805–27.
Steensland, Brian et al. 2000. “The Measure of American Religion: Toward Improving the State of the Art.” Social Forces 79(1):291–318.
July 2, 2014 marked the 50th anniversary of the enactment of the Civil Rights Act of 1964. In February 2014, CCF convened an online Civil Rights Symposium. To read or download the entire symposium, visit here.
Comments