
 This fact sheet was compiled for the Council on Contemporary Families by scholars at diversitydatakids.org.
Asian Americans are often seen as the most affluent racial/ethnic minority group in the United States, the “model minority.” It is true that, overall, their income, educational attainment and neighborhood environment is better than that of Hispanics and Blacks. However, what is often missed is that the Asian American experience is highly diverse. There are significant differences by national origin and across geographic areas. It is important to uncover the variation in the Asian American experience so that we can better understand and address the strengths and vulnerabilities of different subgroups.
Socioeconomic status is highly variable
- Asians have the highest socioeconomic status of any major racial/ethnic group in the U.S., but their
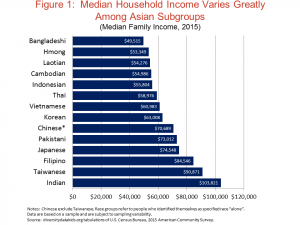 characteristics vary greatly according to their national origin or ancestry. As seen in Figure 1, the median household income of Asian Indians ($103,821), the highest income group, is more than twice that of Bangladeshis ($49,515), the lowest income group. [2015 median household income, from U.S. Census Bureau, 2015 American Community Survey]
 - Asians vary even more dramatically in terms of educational attainment. 77 percent of Taiwanese and 73 percent of Asian Indians (age 25 and over) have a bachelor’s degree or higher, compared to only 14 percent of Laotians and 18 percent of Cambodians [U.S. Census Bureau, 2015 American Community Survey]

Residential segregation among the poor
- Asians are less residentially segregated from non-Hispanic whites than are Blacks or Latinos (less likely to live in separate neighborhoods). However, poor Asians are very segregated from poor whites, and poor Asian children experience extreme segregation—substantially higher even than that experienced by poor Black or Hispanic children. [org analysis of 2015 American Community Survey, 5-year estimates]
Child opportunity in neighborhoods is also highly variable
Separate neighborhoods are often deeply unequal in terms of the opportunities that they offer residents. The diversitydatakids.org/Kirwan Institute Child Opportunity Index is an aggregate measure of neighborhood opportunity for children across neighborhoods in a metropolitan area, based on 19 indicators important for children’s wellbeing. [Following 4 points based on diversitydatakids.org analysis of the Child Opportunity Index and the 2010 Census, Summary File 1]
- Asians are more concentrated in the highest-opportunity neighborhoods of U.S. metropolitan areas than are
 any other major racial/ethnic group. But this does not mean that Asians are uniformly advantaged. Asian racial subgroups are extraordinarily diverse, and there is tremendous inequality among these subgroups.
 - For example, while 50 percent of Taiwanese reside in very high-opportunity neighborhoods (the best 20 percent of neighborhoods within their metro area) this is true for only 5 percent of the Hmong population (see Figure 2).
- In addition to the Taiwanese population, Koreans, Japanese, and Indians are highly concentrated in very high-opportunity neighborhoods.
- By contrast, Hmong, Cambodians, and Laotians are highly concentrated in very-low opportunity neighborhoods (the lowest 20 percent of neighborhoods within their metro area.) A full half of Hmong, 38 percent of Cambodians, and 34 percent of Laotians live in such low-opportunity neighborhoods, compared to only 2 percent of Taiwanese and 4 percent of Koreans.
- Even within the same Asian and Pacific Islander subgroups, the share living in the highest opportunity neighborhoods of their metro area differs substantially across metros. For example, 66 percent of Chinese living in Pittsburgh reside in the very high-opportunity neighborhoods of that metro, but only 19 percent of Chinese living in San Francisco reside in the very high-opportunity neighborhoods of that metro.
Exposure to poverty in public schools
- The average Asian public school student attends a school where 42 percent of students are low-income. This is well below the figures for Blacks and Latinos, where the average public school student attends a school where more than two-thirds (68 percent) of the students are low income. [Civil Rights Project, UCLA; Brown at 62: School Segregation by Race, Poverty, and State]
But again, this average advantage does not accrue to all groups of Asians. One symptom of the extreme segregation facing low-income Asians is a lack of access to support systems such as Head Start programs. The percentage of poor Asian children with access to a Head Start Center is lower than for their counterparts of different racial/ethnic backgrounds. Only 22 percent of Asian and Pacific Islander children in families with incomes below the poverty line reside in a neighborhood that includes a Head Start center, compared to 31 percent of poor Black children and 31 percent of poor Hispanic children.
The authors are part of diversitydatakids.org at the Institute for Child, Youth and Family Policy, Brandeis University. Nancy McArdle is at nmcardle@brandeis.edu
Comments 1
Norma Tan — May 18, 2017
Fabulous to have this disaggregated data and analysis. Thank you!