
Millennial parents should be the most prosperous generation of parents in history. In addition to being better educated than any previous generation and waiting longer to become parents, they are raising children in an economy that is “70 percent more productive than when Baby Boomers were the same age.”[1] Yet, as this brief shows, roughly one out of every five (20.6 percent in 2014) live below the federal government’s outdated and increasingly austere poverty line ($24,000 for a married couple with two children). This is about twice the rate of their counterparts in 1979.
How is TANF working for these parents? The short answer is very poorly, at least as far as we can tell based on the available objective evidence. Compared to better designed federal programs targeted to low-income working parents—including the Earned Income Tax Credit (EITC), the Supplemental Nutrition Assistance Program (SNAP), and Medicaid—TANF is reaching relatively few struggling millennial parents. More parents received employment services and financial assistance under the AFDC-JOBS program two decades ago than do today under TANF.[2] Moreover, the program has heightened inequalities of opportunity and treatment based on where parents and their children live.Economic Hardship among Millennial Parents
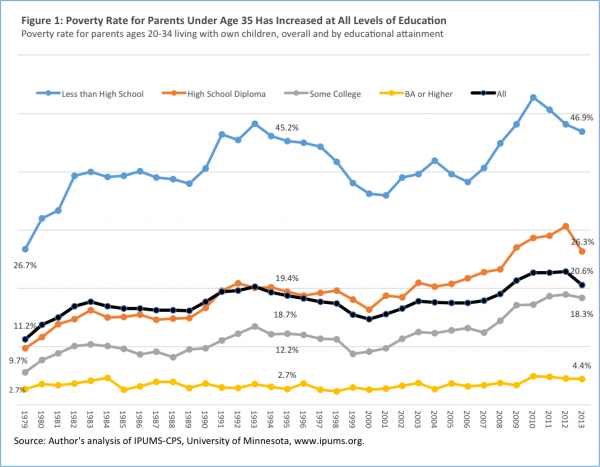
There is broad agreement that millennials are faring worse economically than earlier generations did when they were in their 20s and early 30s, especially once one takes their higher level of educational attainment into account.[3] Figure 1 tracks the official poverty rate since 1979 for parents ages 20-34 living with one or more of their own children.[4] As the black line in the figure shows, the poverty rate for parents ages 20-34 overall increased from 11.2 percent in 1979 to 18.7 percent in 1995. Two decades later, in 2013, it was 20.6 percent. (All three time periods are comparable in that they represent a point four years into an economic recovery; however, the national unemployment rate was higher in 2013 (7.6 percent) than in both 1995 (5.4 percent) and 1979 (5.8 percent)).
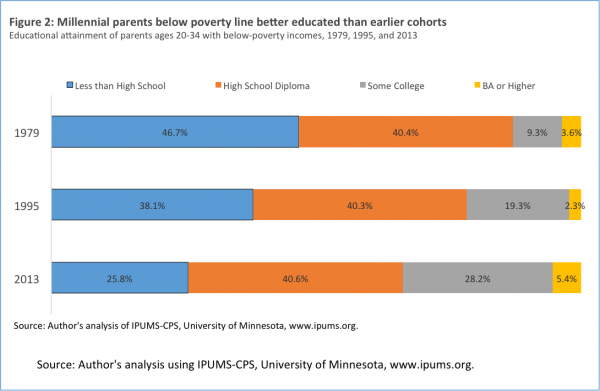
This increase in poverty happened despite increases in educational attainment and mothers’ employment during this period. As figure 2 shows, in 1979, just under half of poor parents under age 35 did not have a high school diploma (46.7 percent), and only about 13 percent had education beyond high school. By 2013, one in three had post-secondary education beyond high school, and only 26 percent had less than a high school diploma.
Some may argue that this increase in poverty is due solely to an increase in single-parent families. Single parenthood has contributed some to the increase in poverty among parents under age 35 since 1979, but most likely only modestly. In 1979, about half (52 percent) of poor young parents were married, compared to 45 percent in 1995 and 40 percent in 2013. But over the same time period, the share of poor parents under age 35 who were living with unmarried parents has increased. Today, about one-third of millennial unmarried parents are living with partners. Under the official poverty measure, unmarried couples, even if they are both living with a shared child, continue to be treated as separate units for purposes of determining whether they are poor.[5] If unmarried parents living with partners were treated as a single unit for poverty measurement purposes, the poverty rate for unmarried parents would be lower than currently reported. However, it probably wouldn’t be that much lower, because unmarried-couple families are more disadvantaged than married ones. Laryssa Mykyta of the U.S. Census Bureau recently estimated the child poverty rate would only be about 1-2 percentage points lower if unmarried parents and their partners were treated as living in the same poverty unit.[6]
Moreover, the poverty rate for married parents under age 35 is higher today (11.7 percent) than it was in 1979 (6.7 percent). And, like the overall trend in educational attainment among poor parents, millennial married parents with incomes below the poverty line are much more likely to have education beyond high school than their baby boomer-era counterparts (about three in 10 have education beyond high school today, almost twice as many as in 1979).
TANF and Millennial Parents
Under TANF, the federal government distributes funds to the states from a $16.5 billion-per-year block grant. States must use their portion of these funds to provide “assistance to needy parents” as well as other benefits and services that states can claim are “reasonably calculated” to further the program’s other three purposes: “ending the dependence of parents on government benefits by promoting job preparation, work and marriage”; “preventing and reducing the incidence of out-of-wedlock pregnancies”; and “encouraging the formation and maintenance of two-parent families.” All states combined must contribute $10.4 billion per year of their own funds under a maintenance-of-effort (MOE) requirement based on what they spent in the early 1990s on AFDC-JOBS.
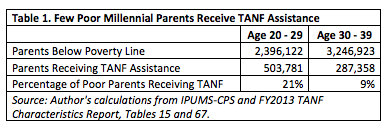
How many millennial parents receive temporary financial assistance for basic needs from TANF? In FY2013, about 504,000 parents age 20-29 received TANF assistance, as did about 287,000 parents age 30-39. (HHS only breaks out the ages of adult receiving TANF assistance in 10-year bands, so 35-39 year olds don’t technically meet my narrower definition of millennial parents). As Table 1 below shows, this means that relatively few millennial parents living in poverty receive TANF assistance. In 2013, only 21 percent of poor millennial parents ages 20-29 received TANF assistance, and only about nine percent of poor parents ages 30-39 received TANF assistance. SNAP, by contrast, reaches considerably more struggling millennial parents.
Why do so few poor millennial parents receive TANF assistance? In general, states have not imposed stricter income and asset limits than were in place under AFDC in the early 1990s. However, under TANF, states must impose additional eligibility requirements that were not allowed under AFDC, and have free-rein to impose even more restrictive rules than are required under federal law, as described also by Stephanie Coontz. For example, under the federal TANF law, states must deny TANF assistance to otherwise eligible families that include an adult who has received more than 60 cumulative months of assistance. Many states impose time limits that are more restrictive than this. Just recently, Arizona became the first state to limit assistance to one single year over a parent’s lifetime.
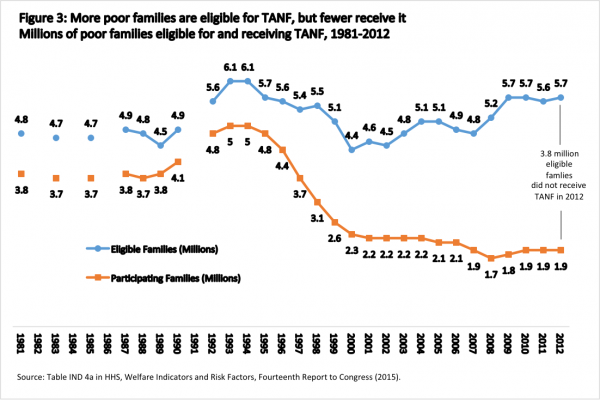
The information we have on participation in TANF by parents who are financially and otherwise eligible for TANF shows that time limits and similar restrictions are not the primary problem. The top line in figure 3 tracks the number of families who were eligible for TANF (and for AFDC before TANF was implemented by individual states) and the bottom line tracks the number of poor families who actually received TANF. In the 1980s and first half of 1990s, about 80 percent of eligible families participated in the AFDC program. TANF was enacted in August 1996 and mostly implemented by states between then and 2000. During this early implementation period, participation by eligible families fell from about 80 percent in 1996 to about 50 percent in 2000. It stabilized briefly above that level in the early 2000s but then started falling again in 2003 until it stabilized again at about 33 percent between 2008 and 2012. This means that in 2012, some 3.8 million families, the majority of whom are likely millennial parents, were poor enough to be eligible for TANF, but were not participating in it.[7]
While time limits and other restrictions have reduced the number of millennial parents who are eligible for TANF assistance, the decline in participation among those eligible is likely due to a broader range of factors. These include: the use of diversion tactics by states and local TANF agencies that aim to prevent eligible families from receiving regular TANF financial assistance as well as unrealistic and overly burdensome work-related requirements that don’t take family obligations and other considerations into account. Finally, most states have very low benefit levels. According to the Congressional Budget Office, “when adjusted for inflation, the value of [the average TANF monthly payment] declined by 30 percent, from about $540 to about $380 in 2013 dollars.”[8] Even for desperate families, the time and other costs involved in obtaining TANF assistance and maintaining eligibility may often outweigh the very modest assistance on offer in most states.[9]
TANF and Regional Inequality
Although often misleadingly described as an “entitlement” program like Social Security or Medicare, states had complete discretion over where they set their AFDC benefit. In most states, benefit levels were rarely adjusted to keep pace with inflation or housing costs.[10]
During his first administration, President Richard Nixon proposed reforming AFDC and the Social Security Act’s means-tested programs for the aged and disabled by creating a national benefit structure. As he put it in a national address: “benefit levels are grossly unequal—for a mother with three children, they range from an average of $263 a month in one State, down to an average of only $39 in another State. Now such an inequality as this is wrong; no child is ‘worth’ more in one State than in another State.”[11] He called it a “new approach” that “aims at ending the unfairness in a system that has become unfair to the welfare recipient, unfair to the working poor, and unfair to the taxpayer” and “aims to make it possible for people—wherever in America they live—to receive their fair share of opportunity.” Nixon’s overall reform failed to get Congressional approval, but Congress did agree to federalize the aged and disabled programs, merging them into SSI in 1972.
Under TANF, the pendulum has swung sharply and much further in the opposite direction. The gross inequalities between state TANF programs go far beyond benefit levels and now extend to a long list of eligibility and program requirements. The impact of these inequalities on millennial parents can be seen in Table 2, which compares poverty and TANF participation among millennial parents in the South (the 16 states and the District of Columbia in the Census Bureau’s South region) with the rest of the United States.
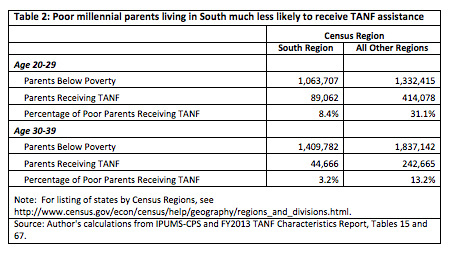
Nearly half (44 percent) of poor millennial parents live in this Southern region, but poor millennial parents living in the South are much less likely than parents living in the rest of the United States to receive TANF assistance. For example, among poor parents age 20-29, only 8.4 percent living in the South receive TANF assistance, compared to 31 percent living in the rest of the United States. This grossly unequal state of affairs is due to at least three factors: 1) the lack of any provisions in TANF establishing a national floor for financial assistance or other national standards for eligibility and treatment; 2) a flawed design that incentivizes states to shift TANF funds from financial assistance to other uses, including ones that are not means-tested or are only loosely related to TANF’s core purpose; and 3) a flawed funding formula that short-changes poorer states, including nearly all of those in the South relative to other states. A related factor is historical and ongoing structural discrimination within states. Nationally, about 26 percent of poor millennial parents are black, but in the South, just over half (53 percent) are black.[12]
The case of Massachusetts versus Mississippi
The current allocation of the $16.5 billion in TANF funds among the states bears little relationship to how funding for a program designed to increase work, family stability and child well-being would be distributed if rationally based on objective indicators. The Annie Casey Foundation ranks states on child well-being using objective data across four domains: economic well-being; education; health; and family and community. In the most recent ranking, Massachusetts ranks first and Mississippi ranks last. A reasonably designed federal program would aim to improve child well-being in both states, but would aim to narrow the gap by delivering greater resources to Mississippi. Yet, even before adjusting for economic and other differences, Massachusetts receives over 2.5 times the amount of TANF funding per poor child ($1,100) than Mississippi ($410). Housing costs are lower in Mississippi than in Massachusetts, but Massachusetts also provides more amenities, including better public schools, to its residents than Mississippi. Even if one takes differences in living costs into account, the magnitude of inequities in funding are indefensible, especially in a program that should be aiming to reduce inequalities of opportunity that exist across states.
Reforming TANF
Some of what TANF should be doing for struggling parents and their children would arguably be better accomplished through expansions of child care, the Child Tax Credit, and other social insurance programs, as well as strengthening labor market institutions in ways that improve the bargaining position of poorly compensated workers. For example, my colleagues at the Center for American Progress have proposed making the Child Tax Credit fully refundable, so that all working-class parents receive the $1,000 it currently provides to nearly all upper-middle class parents.[13] They also propose establishing an additional Young Child Tax Credit for children under age three. And, in partnership with the Georgetown Center on Poverty and Inequality and the National Employment Law Project, they have proposed a series of reforms to strengthen the Unemployment Insurance system, including the creation of a Jobseeker’s Allowance that would provide financial assistance to job seekers who are ineligible for UI.[14]
But even if reforms are made in these areas, we will continue to need a well-functioning and fair program that provides temporary financial assistance and employment services to disadvantaged parents who are struggling to get a foothold in the job market or improve their skills, as well as ones who are unable to work or would be better off not working for a time for family reasons.
Among the structural reforms that should be considered: splitting TANF into two completely separate federal programs: one dedicated to providing financial assistance to struggling families according to national standards that treat families fairly, and a second that provides funding to states for effective social services based on an equitable funding formula.
Real reform of TANF may take a while, but there are at least two reasons to be optimistic. First, we have a set of national programs, including EITC, the Child Tax Credit, and SNAP, that provide a strong foundation to build on. Second, there is good reason to think that the diverse millennial generation of policymakers will bring a new mindset to the task of reform.[15]
Footnotes:
[1] Brendan Duke, When I was Your Age: Millennials and the Generational Wage Gap, Center for American Progress, March 3, 2016, https://www.americanprogress.org/issues/economy/report/2016/03/03/131627/when-i-was-your-age/
[2] In FY2014, 490,000 adults receiving TANF were working or participating in work-related activities in one or more hours. Table 7B in Work Participation Rates—Fiscal Year 2014. http://www.acf.hhs.gov/sites/default/files/ofa/wpr2014table07b.pdf. By comparison, in FY1994, 593,000 adults receiving AFDC were participating in work-related activities in AFDC’s JOBS program (Table 8.9 in 1996 Green Book). These numbers aren’t strictly comparable, but taking these differences into account would only increase the number of parents participating in work or work-related activities under AFDC compared to TANF. For a detailed analysis of trends in participation in work and work-related activities under AFDC and TANF, see Peter Germanis, TANF is Broken!, July 2015, http://mlwiseman.com/wp-content/uploads/2013/09/TANF-is-Broken.072515.pdf.
[3] See, e.g., Pew Research Center, The Rising Costs of Not Going to College, February 2014, http://www.pewsocialtrends.org/2014/02/11/the-rising-cost-of-not-going-to-college/.
[4] The federal poverty measure is a very imperfect measure of economic hardship. Because it has only been adjusted for inflation and not for increases in median or average family incomes since the 1960s, it has fallen further and further below the amount of family income needed to have a mainstream or middle-class standard of living. Moreover, it uses a pre-tax measure of income that doesn’t include some important transfer programs, such as SNAP and the EITC, or needs like child care, education, and health insurance. As a result, it likely undercounts economic insecurity today compared to 1978 because it has not kept pace with increases in mainstream living standards. At the same time it undercounts economic insecurity in other ways because it doesn’t count the EITC or SNAP, which have become increasingly important. See Shawn Fremstad, A Modern Framework for Measuring Poverty and Basic Economic Security, Center for Economic and Policy Research (2010), http://cepr.net/publications/reports/a-modern-framework-for-measuring-poverty-and-basic-economic-security. Still it does provide a commonly used measure of economic hardship that takes earnings and income from programs like Social Security, Unemployment Insurance, TANF, and SSI into account.
[5] A family consisting of two unmarried parents living with their shared child is split into two units: a two-person unit consisting of one of the parents and the child, and a separate one-person unit consisting of the other parent. Each unit has its own poverty threshold and their income is not counted together. If the income and needs of unmarried partners were counted together, some millennial parents currently classified as poor would no longer be counted as poor (because the partner’s income lifts the unit above the higher poverty threshold), while other partners of millennial parents classified as not poor would be now be counted as poor (because any income they have does not put the unit above the higher poverty threshold).
[6] Laryssa Mykyta, All Our Kin? Measuring Poverty using Alternative Family Definitions 2007-2015, Presentation at CPS Forum on Poverty and Family, July 8, 2016. Other research suggests that unmarried couples with children generally have very high poverty rates—roughly midway between married couples and single parents—even when income and needs are counted together. See Shawn Fremstad, Partnered but Poor, Center for American Progress, 2016, https://www.americanprogress.org/issues/poverty/report/2016/03/11/131968/partnered-but-poor/.
[7] Although we don’t have estimates of TANF participation that are limited to eligible millennial parents, there is little reason to think that they would look much different. Most parents who do receive help from TANF today are millennials. Under AFDC, most parents who received help were in the same age range as millennials today. On balance, the age distribution of parents who receive help from TANF skews a bit younger than that of parents who received help from AFDC, but the difference isn’t big enough to make a real difference. Millennials may be less negatively impacted than older parents by some TANF policies (like TANF limits), but more negatively impacted by other ones (like restrictions on pursuing post-secondary education).
[8] Congressional Budget Office, Temporary Assistance for Needy Families: Spending and Policy Options, January 2015, https://www.cbo.gov/publication/49887.
[9] See, e.g., Chico Harlan, “Lonely road: For the poor in the Deep South’s cities, simply applying for a job exposes the barriers of a particularly pervasive and isolating form of poverty,” The Washington Post, December 28, 2015, http://www.washingtonpost.com/sf/business/2015/12/28/deep-south-4/ and Robert Moffitt and others, A Study of TANF Non-Entrants, Final Report to the Office of the Assistant Secretary for Planning and Evaluation, Department of Health and Human Services, November 2003, http://web.jhu.edu/threecitystudy/images/publications/16_moffitt_final1.pdf (finding disadvantaged families “diverted” from entering by TANF agencies in three major cities were non-entrants were significantly more likely to be disabled or have other health problems than TANF entrants).
[10] The characterization of AFDC as an “entitlement” is also often used pejoratively in a way that implies parents who received AFDC had a “right” to it without any reciprocal obligations. But after the passage of the Family Support Act of 1988, AFDC-JOBS had meaningful job training and work requirements for most adults who had received benefits for more than a short period of period, although these varied somewhat from state to state.
[11] President Richard Nixon, Address to the Nation on Domestic Programs, August 8, 1969, http://www.presidency.ucsb.edu/ws/?pid=2191.
[12] On race and TANF, see, e.g., Joe Soss, Richard C. Fording, and Sanford F. Schram, Disciplining the Poor: Neoliberal Paternalism and the Persistent Power of Race (2011) and Martin Gilens, Why Americans Hate Welfare: Race, Media, and the Politics of Antipoverty Policy (1999).
[13] Rachel West, Melissa Boteach, and Rebecca Vallas, Harnessing the Child Tax Credit as a Tool to Invest in the Next Generation, Center for American Progress, August 12, 2015, https://www.americanprogress.org/issues/poverty/report/2015/08/12/118731/harnessing-the-child-tax-credit-as-a-tool-to-invest-in-the-next-generation/
[14] Rachel West and others, Strengthening Unemployment Protections in America: Modernizing Unemployment Insurance and Establishing a Jobseeker’s Allowance, Center for American Progress, Georgetown Center on Poverty and Inequality, and National Employment Law Project, June 2016, https://www.americanprogress.org/issues/poverty/report/2016/06/16/138492/strengthening-unemployment-protections-in-america/.
[15] See, e.g., Sean McElwee, Millennials are significantly more progressive than their parents, The Washington Post, March 24, 2016, https://www.washingtonpost.com/news/in-theory/wp/2016/03/24/millennials-are-significantly-more-progressive-than-their-parents/?utm_term=.4f20468736df.
Comments