
The short answer is, pretty well. But that’s not really the point.
In a previous post I complained about various ways of collapsing data before plotting it. Although this is useful at times, and inevitable to varying degrees, the main danger is the risk of inflating how strong an effect seems. So that’s the point about teen test scores and adult income.
If someone told you that the test scores people get in their late teens were highly correlated with their incomes later in life, you probably wouldn’t be surprised. If I said the correlation was .35, on a scale of 0 to 1, that would seem like a strong relationship. And it is. That’s what I got using the National Longitudinal Survey of Youth. I compared the Armed Forces Qualifying Test scores, taken in 1999, when the respondents were ages 15-19 with their household income in 2011, when they were 27-31.
Here is the linear fit between between these two measures, with the 95% confidence interval shaded, showing just how confident we can be in this incredibly strong relationship:
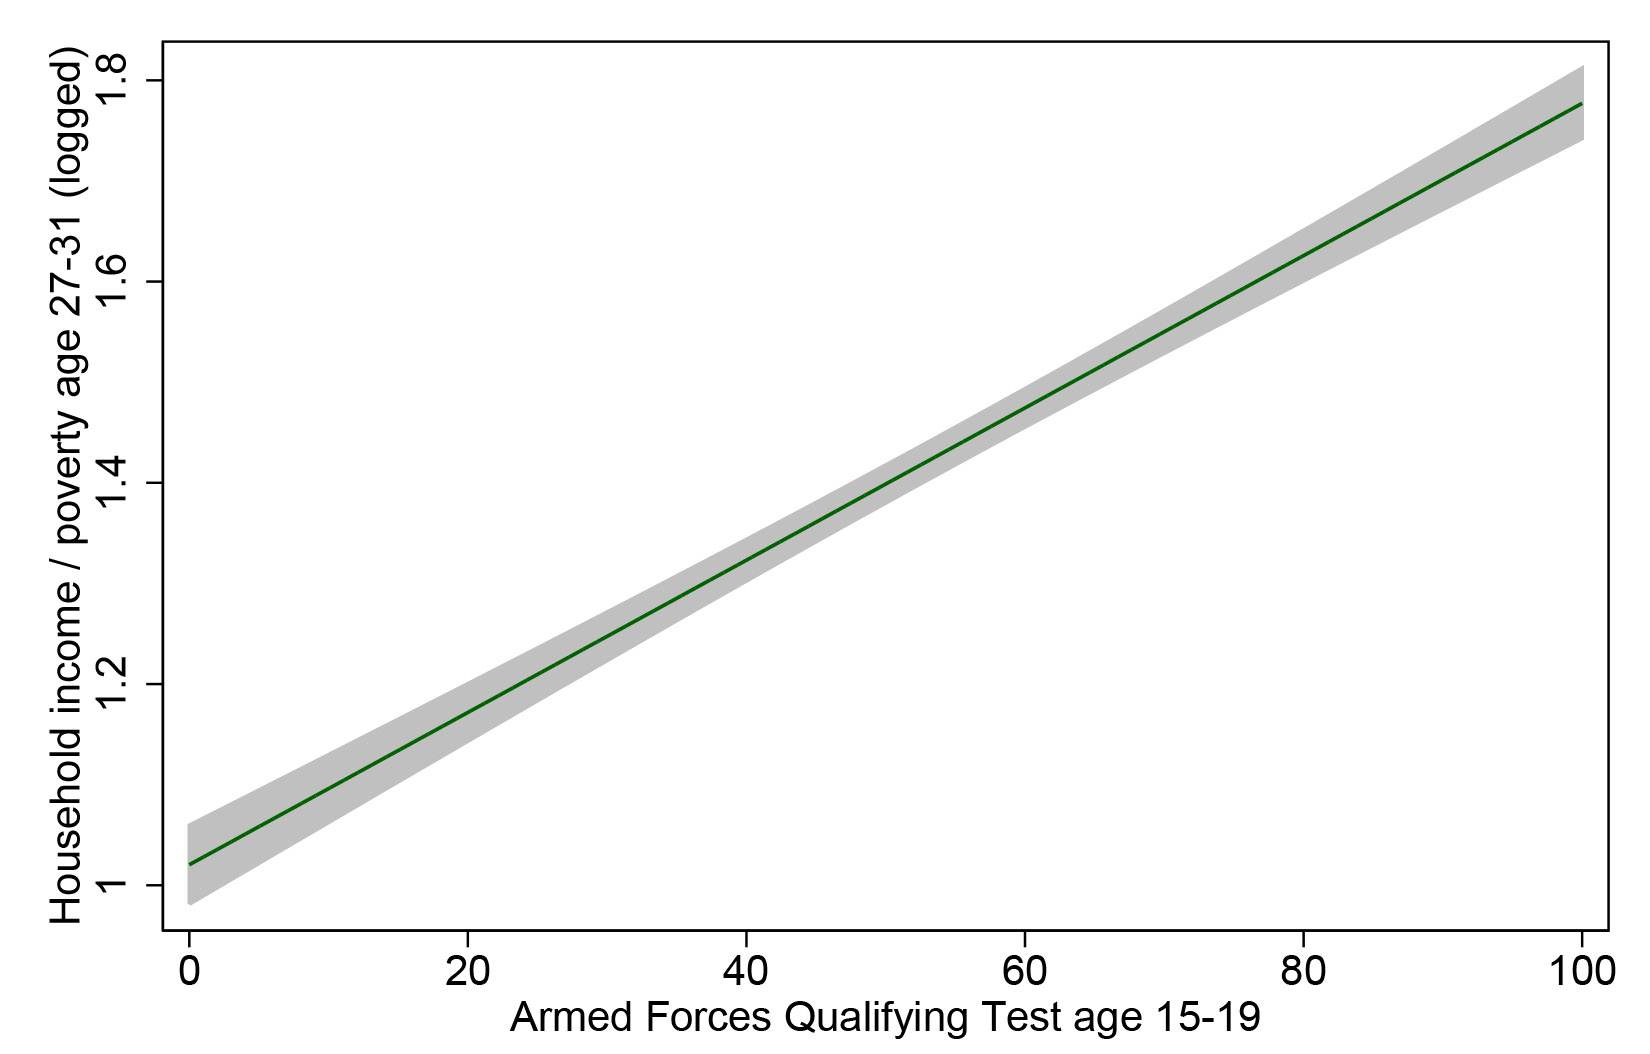
That’s definitely enough for a screaming headline, “How your kids’ test scores tell you whether they will be rich or poor.” And it is a very strong relationship – that correlation of .35 means AFQT explains 12% of the variation in household income.
But take heart, ye parents in the age of uncertainty: 12% of the variation leaves a lot left over. This variable can’t account for how creative your children are, how sociable, how attractive, how driven, how entitled, how connected, or how White they may be. To get a sense of all the other things that matter, here is the same data, with the same regression line, but now with all 5,248 individual points plotted as well (which means we have to rescale the y-axis):

Each dot is a person’s life — or two aspects of it, anyway — with the virtually infinite sources of variability that make up the wonder of social existence. All of a sudden that strong relationship doesn’t feel like something you can bank on with any given individual. Yes, there are very few people from the bottom of the test-score distribution who are now in the richest households (those clipped by the survey’s topcode and pegged at 3 on my scale), and hardly anyone from the top of the test-score distribution who is now completely broke.
But I would guess that for most kids a better predictor of future income would be spending an hour interviewing their parents and high school teachers, or spending a day getting to know them as a teenager. But that’s just a guess (and that’s an inefficient way to capture large-scale patterns).
I’m not here to argue about how much various measures matter for future income, or whether there is such a thing as general intelligence, or how heritable it is (my opinion is that a test such as this, at this age, measures what people have learned much more than a disposition toward learning inherent at birth). I just want to give a visual example of how even a very strong relationship in social science usually represents a very messy reality.
Cross-posted at Family Inequality and Pacific Standard.
Philip N. Cohen is a professor of sociology at the University of Maryland, College Park, and writes the blog Family Inequality. You can follow him on Twitter or Facebook.
Comments 15
Taylor B — May 13, 2014
My mother-in-law teaches education policy and one thing she really brings up (because this was her experience as the daughter of immigrants) is that children from higher socio-economic classes tend to do better in school because they have parents who understand the system. Part of their upbringing is geared towards the methodology of school systems and their parents understand how to navigate grades, activities, resources, etc. This becomes particularly poignant as the children get older and they have to start thinking about college. She studied a number of students across several districts who were promised a scholarship if they graduated with a certain GPA. What she found was the kids who didn't have parents who understood the intricacies of the system were wholly unprepared to apply for college. They didn't even know it cost to apply because they had no idea where to look. (As a teenager, she only applied to NYU because an acquaintance suggested it and her parents simply dropped her off in the fall - she didn't know how to find housing or sign up for classes, get financial aid, anything.) There is a correlation between economic status and understanding the educational system, which is part of the reason kids from well-off backgrounds tend to be much more successful: they understand the institutions they must navigate for success.
Andrew — May 13, 2014
I'm not a statistician, but I'm pretty sure it's misleading to call that a 95% confidence interval. You mean that's a 95% confidence interval on the linear regression's parameters, not a region containing 95% of the data.
Betty P Wiggins — May 14, 2014
Is the military-aptitude test something we want to be calling "test scores" generically? I scored extremely high on the actual test, but my military aptitude was very low. My physics teacher said the military had no need for many generals.
Roger — May 14, 2014
It would be interesting to know whether the correlation is similar for males and famales.
Damn Skippy — May 15, 2014
I think Dr. Cohen is correct. You could certainly produce a graph like this to make a point that isn't necessarily true. Speaking from personal experience, I scored highly on the AFQT and entered the Army at age 17. I spent 6 years in, and eventually obtained a B.S. degree by going to night school. I now have an income approx. 7 times the U.S. Poverty Level for a family of 5. BUT!
I came from a broken family and had no opportunity to go to college. None of my relatives had ever gone to college. I did well in high school, and if my parents had the means, I would have gone to college, and ended up in the same field with perhaps the same income. My question is whether or not the statistical sample is valid. Many of my peers came from similar situations. No opportunity to go to college or learn a trade. Although I was patriotic (still am, somehow) I was there to learn a job skill while serving my country. If my parents could have afforded college, or were smart enough to help me obtain student aid, I would have gone to college instead. But, I had military recruiters lined up at my school willing to give me a job and teach me a skill instead. Fortunately for me, it paid off.
With the exception of commissioned officers (who would not be included in this demographic because that requires a 4 yr. degree and would likely push your age past 19), It seems that the sample is of kids who were not college bound because of poor academic scores, or because (like me) their family could not afford college, and weren't educated enough to navigate the system. It only seems logical that people from this background would have the outcomes illustrated above. Smart kids from broken families learn a skill while paying for college, learn leadership, learn respect for authority, learn discipline, and end up with something that looks pretty good on a resume to an employer. Kids who didn't do well academically in high school, probably joined the military as a last resort. Some make a remarkable transformation and become great soldiers. Many of those individuals have "found their calling" and chose to stay in the military, where their income SADLY will keep them nearer to the poverty level than those who take their skills to the private sector.
Felix Andrea — June 3, 2024
Although there is a significant relationship between adolescents' test scores and later earnings, this reflects only a small part of each individual's life and potential. This reminds me of the rice purity test - a test to evaluate the "purity" level of young people. Likewise, assessment indicators only tell part of the story, and to get a comprehensive view, we need more in-depth interviews or direct observations.
Emilybaul — June 5, 2024
Interesting post it was, for discussing but there are also very illustrative and well-authorized Take a class for me available all over the USA reflectively.
Thomas Snow — June 22, 2024
Our PMP Exam Help Services are a suitable fit to take my PMP test. Pay me to do my PMP exam for me. Our online PMP exam taker will get you good scores.
MyAsianTV — July 28, 2024
Official Myasiantv free watch, download and get update about latest drama releases in Korean, Taiwanese, Hong Kong, and Chinese with English subtitles.
Gloria Nelson — September 24, 2024
To get a sense of all the other things that matter. premium book writing company
Amelia Hedge — November 26, 2024
The correlation between teen test scores and adult income is a topic of much debate. While strong academic performance in high school can open doors to higher education and career opportunities, it doesn't always guarantee future success or income. Many factors, such as personal development, networking, and career choices, also play a crucial role. However, excelling in subjects like math can provide a solid foundation. If you're struggling with math exams, seeking Online Math Exam Help can ensure you perform your best and set yourself up for future success.
Eco liv — September 9, 2025
It's fascinating how teen test scores offer just a glimpse into future potential. While they may hint at academic skills, adult income is influenced by resilience, creativity, opportunity, and even luck—things no standardized test can measure. On a different note, for anyone looking to make smart choices in everyday life, Eco Liv is providing some of the best deals and discount codes on electronics, pets, jewellery, travel, gifts, clothing & apparel, and more—proof that planning ahead can pay off in ways far beyond test scores!