
Elyse Mc.D. sent in this graphic based on data from the Stanford Center for the Study of Poverty and Inequality that summarizes a number of aspects of inequality.
You can get a larger version here. I took screencaps of three of the figures I found most striking:

Via.
Comments 38
sodium11 — April 17, 2011
Excellent concept - but the execution is flawed in many respects:
- White text on a yellow background is virtually impossible to read.
- "Gender Gap in Pay": the areas of the pink circles do not correspond to the percentages indicated. This is a common error with this kind of chart: calculating the radius of each circle based on the percentage, which results in the areas being inaccurate and deceptive.
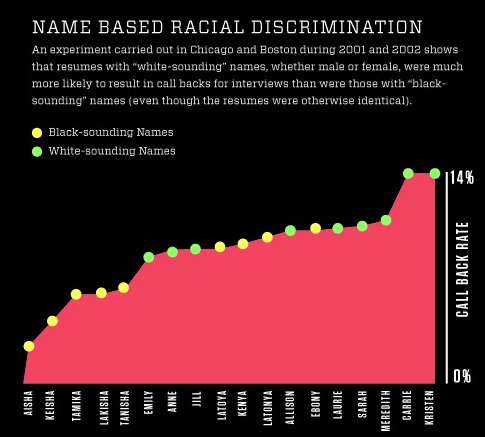
- "Occupation Sex Segregation": No explanation for why many of the right-column bars do not add up to 100%.
- "Homelessness": If the green houses are meant to represent the "1 in 5 chronically homeless", there need to be 10 more green houses.
- "Racial gaps in education": The pink and green boxes in each row are almost equal in size, but the pink box should be about twice as big in each case. Presumably the result of measuring the right edge of each box from the left axis, which results in a visually deceptive result. (You'd have to measure each box from the right edge of the previous box or break them into separate bars.)
James — April 17, 2011
These graphs are pretty counter-productive for those who prefer this whole fast-food method of learning factoids. Lazy compiling, that despite being in a visual format, isn't any easier to digest over the plentiful statistics made easily available from many progressive news sources.
Hard to even look at, the combination of horrible design, color pallet, outdated information, and some statistics are even benign in the grand scheme of 'things unjust' in America.
Missdisco — April 17, 2011
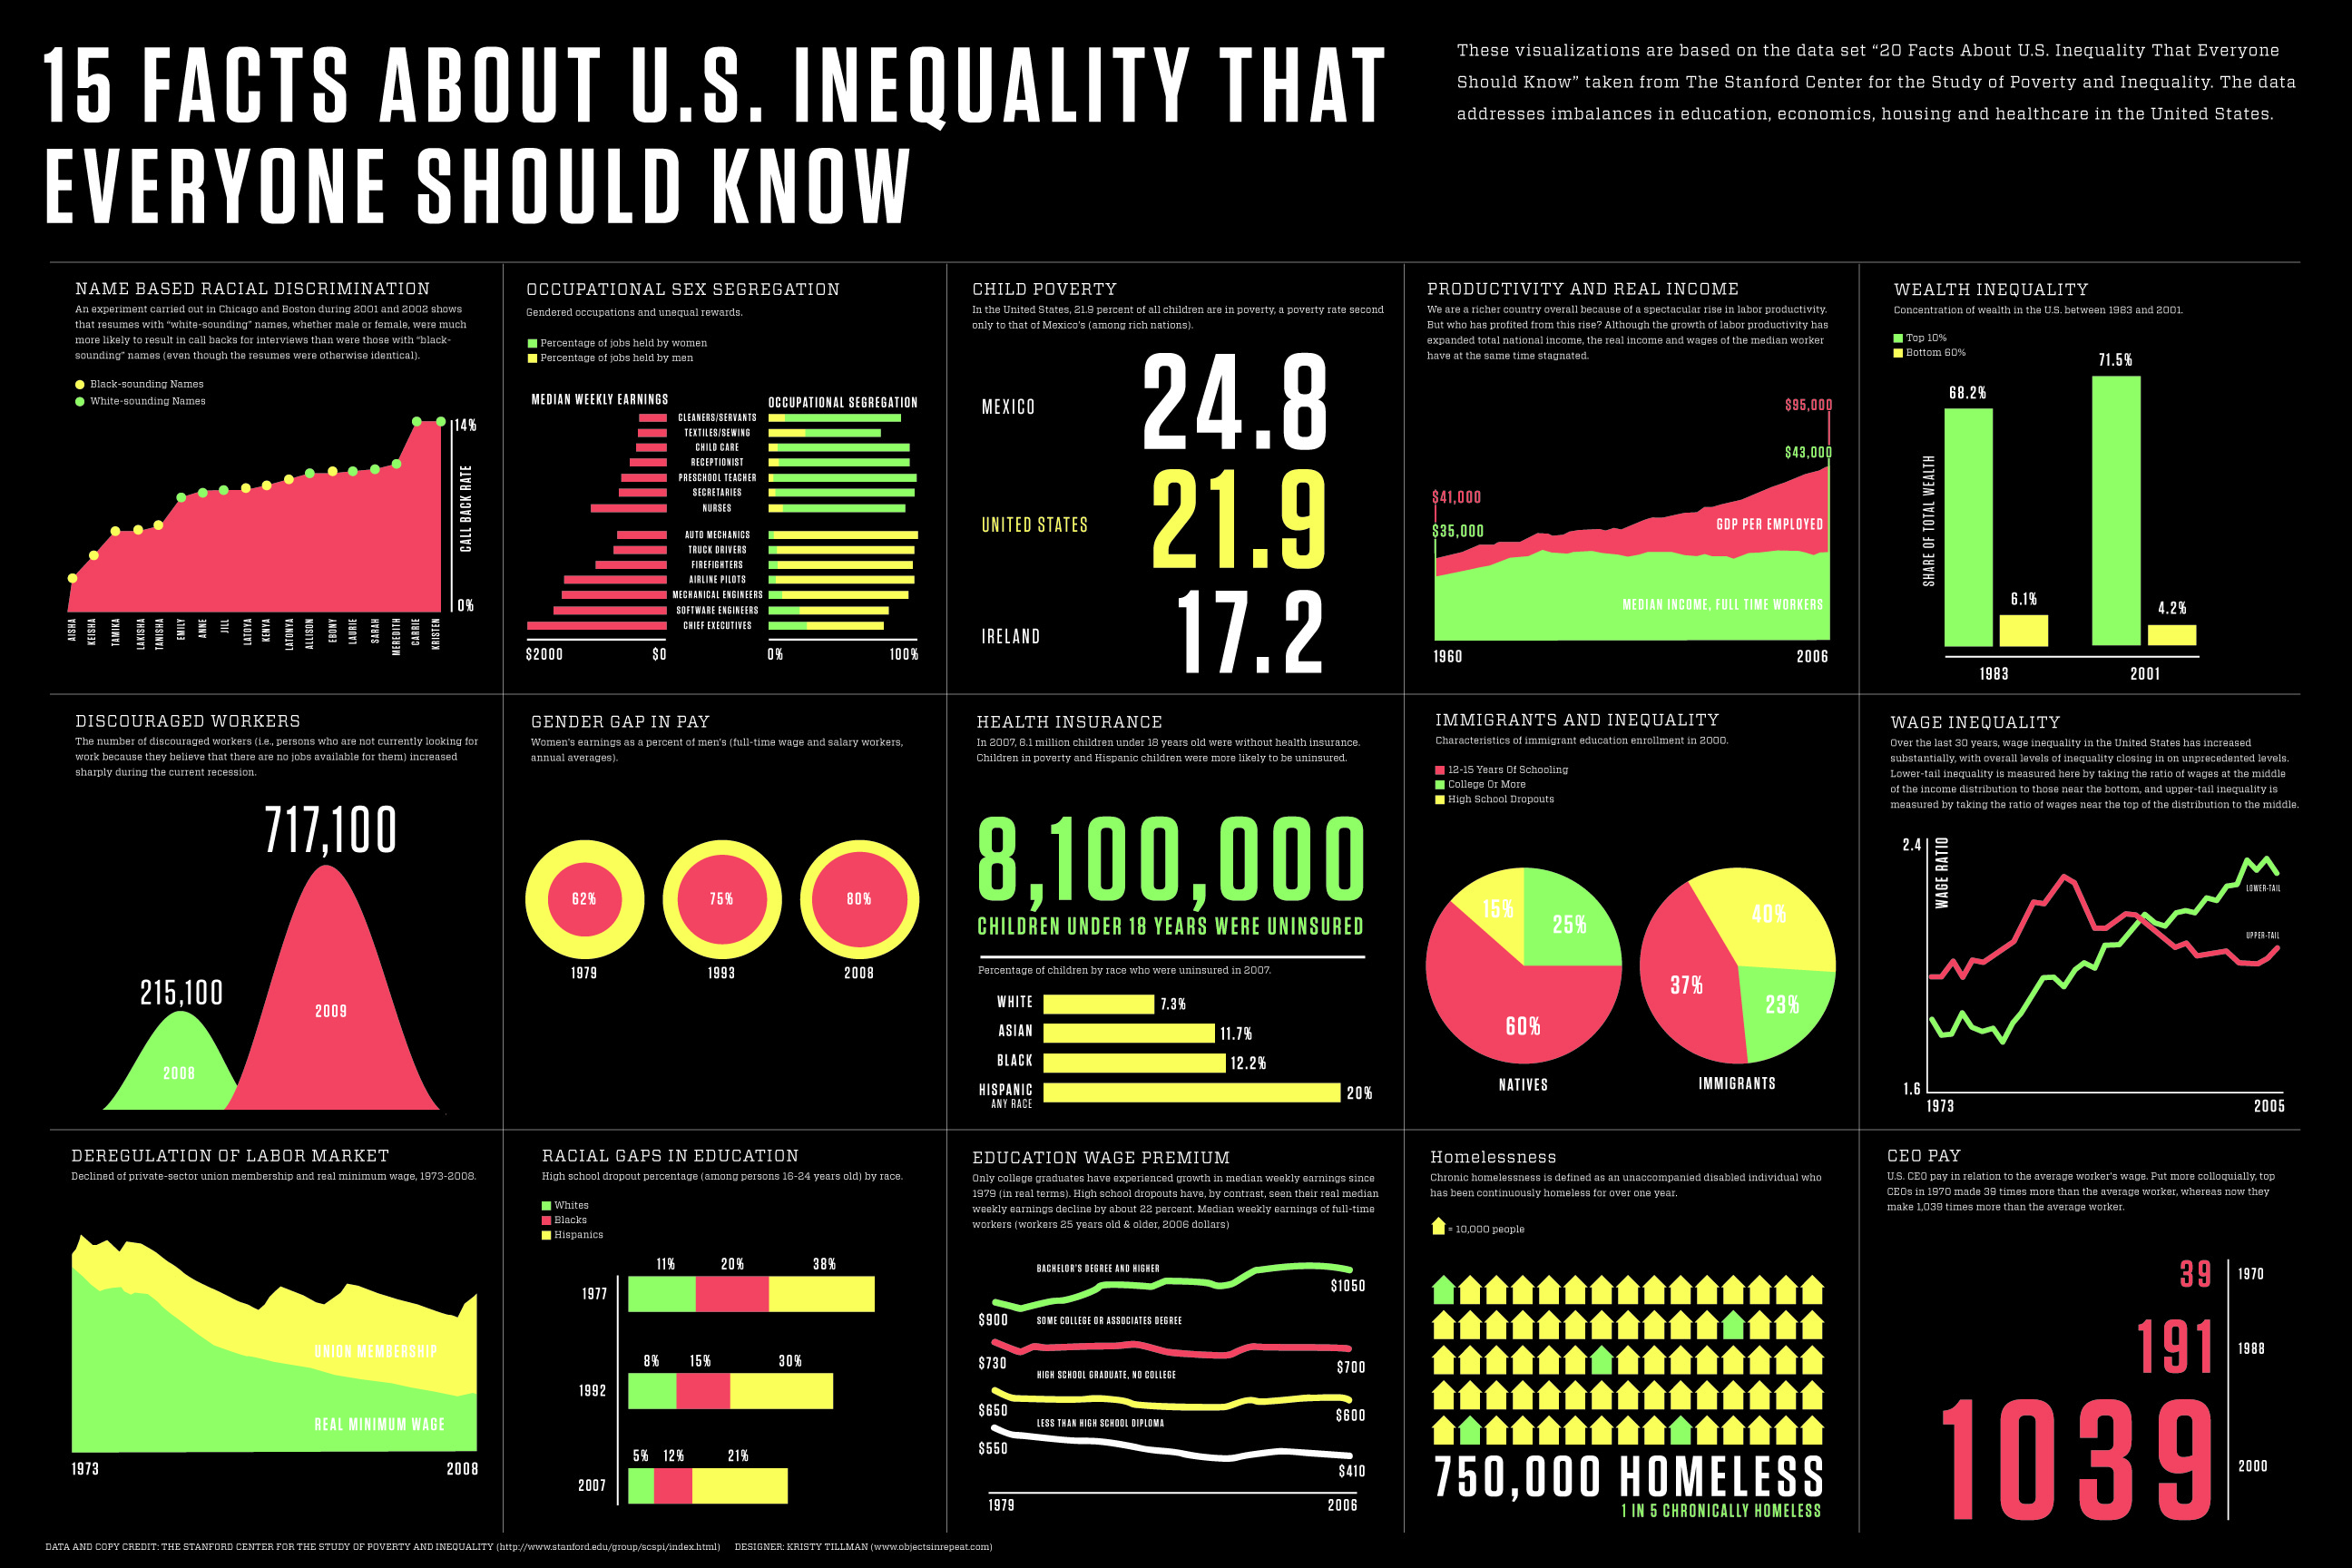
The names graph seems so odd. Carrie and Kristen though strike me as very American Names, while Emily and Anne strike me as very English. Any reason why such a big difference? Or are they just very common names stateside?
Why does Ebony do similarly to Allison and Laurie? Since Ebony is a magazine for black people, I'd assume that'd be a common assumption, so if race affects decisions, it seems interesting that that's the highest name for black girls.
azizi — April 17, 2011
With regard to "Black sounding names", some folks here may be interested the fact that Mormon names share a number of structural characteristics with distinctive African Amererican names.
It's important to note that giving distinctive first & second names has been a cultural tradition among African Americans for a very long time. This tradition has been traced back to the 17th century by sociologist and folklorist Dr. Newbell N. Puckett. A small percentage of African American non-traditional names that were given in the 19th & early 20th century are still used by African Americans today. Furthermore, some of those names share characteristics with a portion of African American names that are the focus of this page-contemporary names that are of post-1960s origin.
The Church of Jesus Christ of Latter-day Saints (abbreviated as the LDS Church and known as the Mormon Church) was founded in 1830. I'm not sure when some Mormons began to give distinctive names, but it appears that that practice increased after the 1960s, which is the same period of time that giving non-standard names also increased among African Americans. I believe one of the key reasons for this practice occuring at that time was the emphasis upon multiculturalism. I definitely don't think that the similarity in modern naming traditions among African Americans and Utahnans is because either African Americans or Mormons as a group purposely copied off of the other.
According to 2008 data, Black people comprise 1.3% of the residents of the state of Utah. Black people comprise 12.8% of the population of the United States.
-http://quickfacts.census.gov/qfd/states/49000.html
Here are some examples of distinctive Morman personal names that "sound like" "Black sounding" names. These Morman (Utahnan) names are from
http://wesclark.com/ubn/
Male:
LaGene; LaJuan; LaMar; JaVon, Cordell, Coshell; DarVel; Darvell; Daaron; Dason ; LaVaun ; D'Monte; D'Brett; De'Bracy: La'Donis
Female:
Ladaysa; Lachelle; LaDawn; LaDoya; LaTisha ;Shalissa; Shamaya; Shanisha;
Shareika; Shantel; Shantell; Shantelle ; LaVonne; Lavonda; LaShawna
For more examples and information, visit this page on my website http://www.cocojams.com/content/similarities-between-african-american-names-mormon-names
**
If it's true that distinctive personal names negatively influence hiring Black people, and I don't doubt that it's true, has there been any studies of the impact of distinctive names on hiring White people with "Morman" names?
Marc — April 17, 2011
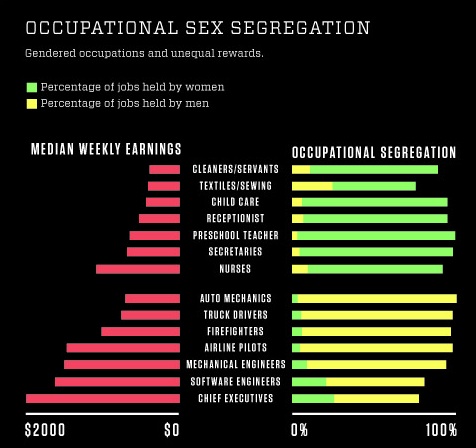
I had a thought regarding the time-value of educational attainment. During the period studied, the percentage of people earning a bachelor's has gone up as access to education has increased. I tend to think that at least 60% of what makes a good employee is set by about 15 yrs old (honesty, basic intelligence, responsibility level). I wonder if the value to an employer of the average high-school dropout has decreased, as the more able cohort of that group becomes more likely to go to college.
Ross Bennett — April 17, 2011
I find it difficult to believe that some 20% of software engineering jobs are held by neither men nor women.
There have been a number of errors introduced in moving the data from the original studies into these graphics. It's unfortunate that such errors will adversely impact the credibility of the data.
Liz — April 17, 2011
You didn't finish typing in the title to this blog entry. Allow me to do it for you: VISUAL OVERVIEW OF INEQUALITY IN THE UNITED STATES.
It is disappointing that even on this blog we see the assumption that it is not necessary to label United States specific studies as such. When I see "VISUAL OVERVIEW OF INEQUALITY," I expect to see a study of the entire world. If the study is of a particular country or geographic area, it should be so labelled.
You do not do so, however, because being from the dominant country both in the world and on the internet, you have the privilege of assuming that every study or discussion is about the United States. But as far as I can see, this site is called Sociological Images, not Sociological Images in America, and indeed I learned of this site when you recently featured a Canadian advertisement. But even if this site is only about images in America, the omission stings.
If I posted a blog entry on my Canadian blog about inequality in Canada, I would need to label it as being about inequality in Canada in order for that to be automatically understood.
Your omission is even more offensive vis-a-vis countries from the South. Please stop rendering the rest of the world invisible.
Yrro — April 18, 2011
So, wait, is the article honestly saying that mechanical and software engineers should be paid the same as preschool teachers?
Not that I think preschool teachers are currently overpaid - my mother is one, and I have several friends who are teachers as well. But the educational and mental requirements for the two technical fields are much higher. Educating well takes a good amount of skill in managing a classroom and dealing with children, but at the heart of it, an education degree and getting a job, at least, requires a skillset that is much more common than the ability to handle two years of calculus before you get to your actually hard classes.
In general... the women dominated fields they chose, with the exception of nursing (which is a very challenging field), do not require the level of technical expertise as the male dominated fields chosen (with the exception of truck drivers... who have a good union - I honestly have no idea why truck drivers are paid so much, other than maybe it is a crappy job that takes you away from your family). I mean, it is an interesting data point in that we can discuss why women are choosing to avoid fields that are more competitive or require harder math, but I don't think you can just point to it directly as an example of inequality. Heck, most engineering schools have a whole department devoting to trying to convince women to go there. They unfortunately aren't having a lot of luck.
Alexander — April 18, 2011
You all need to quit watching so much TV. I don't think that you grasp the point of something when you contemplate more over the color scheme of the graphs than the actual information they represent. I think that most of the comments on this page just kind of prove the point of how blind people are in their commercialized fast-food junkie hazes.
Interesting News Stories And Articles…Apr. 18 « Welcome to the Doctor's Office — April 18, 2011
[...] VISUAL OVERVIEW OF INEQUALITY by Gwen Sharp, [...]
Cecelia — April 20, 2011
Why isn't Native American/Alaskan Native included in this? Wait...I know... we are never included in these kinds of studies because we are Invisibly Native to the majority population. Very frustrating as per usual.
Images of Inequality | — April 20, 2011
[...] These images are data from a report by the Stanford Center for the Study of Poverty and Inequality, posted at Sociological Images. [...]
What We Missed. — April 20, 2011
[...] Some really great images on some not-so-great data about race and economic disparities. [...]
Seeing Inequality, Keeping Trans Transparent, Criticizing Gwyneth and More: Editors’ Picks, 4/17-4/23 : Ms Magazine Blog — April 23, 2011
[...] Sociological Images: a visualization of inequality in the U.S., from name-based racial discrimination to the ever-growing gap between the rich and the [...]
For your information… « Oh, Say Can You Say? — April 23, 2011
[...] Gwen of Sociological Images (which you must check out if you haven’t) posted thoughts on a visual overview of inequality in the U.S. [...]
Anonymous — April 29, 2011
impossibly difficult to read
Best of 2011: Weed Is Not a Gateway Drug, Politics and Religion Are Key in Choosing Mates, and More Random Stories of 2011 « Welcome to the Doctor's Office — December 29, 2011
[...] VISUAL OVERVIEW OF INEQUALITY by Gwen Sharp, [...]
Continued Economic Inequality | Erin V Echols — February 26, 2012
[...] Two economists who conducted an experiment in the early 2000′s found that applicants with white-sounding names (ex. Emily and Greg) received 50% more callbacks for job interviews than applic... (ex. Lakisha and Jamal) even when the applicant’s qualifications were identical (2). In [...]
Anonymous — September 29, 2021
1) this data is important because it shows how our world works and how much of that is based on racism
Anonymous — September 29, 2021
The impact of this data on my view of the world is confirming my dislike/hatred for our capitalist and racist society. America is a racist country whether you agree or not, and that is very evident in this data. The sexism, racism, and ableism within our country and our jobs is astonishing and disgusting. This shows how only white, rich, men in America will be completely successful. (Jeffrey Bezos, Bill Gates, Elon Musk, etc)
David Gyasi — November 9, 2022
Not very well done. The colors are poorly matched. For just a glimpse, it's okay. I believe that to create quality charts and graphs, you can use quality software.
Nicholas — November 11, 2022
Yes, you are absolutely right. The colors hit the eye. Especially the fact that you have to stare. Although today there are many programs that can make a good presentation. At https://yellow.systems/blog/create-an-app-like-yelp, you can find out how to create an app like yelp. They say they're pretty good experts here.
Elsa — November 13, 2022
Well done, a good article, I've found some really interesting facts for myself here.