
Prolific sender-inner Dmitriy T.M. sent in a link to a story at Slate showing increases in rates of U.S. adults of diabetes between 2004 and 2008, as well as the distinct regional variations. You can look at maps individually or watch a time-lapse slide show.
Percent of adults diagnosed with diabetes in 2004:
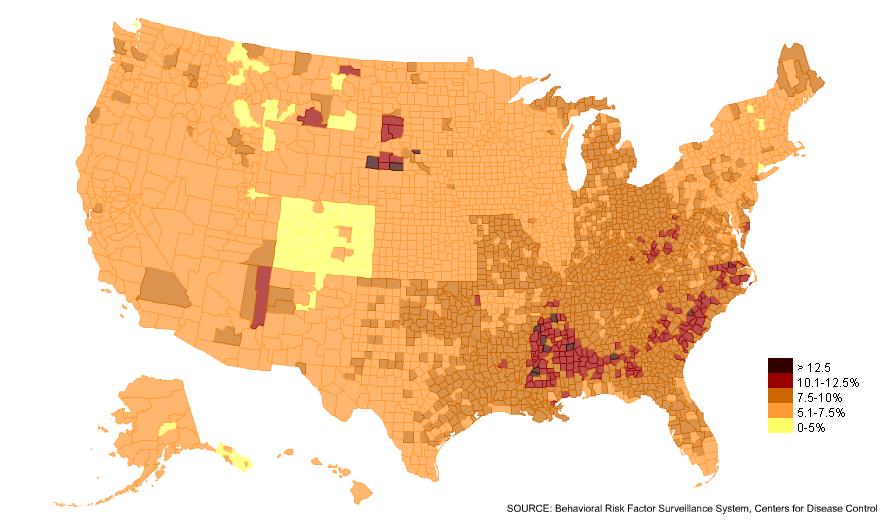
2008:

The change is pretty dramatic for such a short time period. I presume differences in poverty rates, access to health care, and nutritional differences all play a part. Any demographers or public health scholars out there with insights?
The CDCP has the data available for download, and you can play around with different maps (# of adults instead of % and so on).
UPDATE: Reader Arielle says,
Please clarify the type of diabetes this graph is discussing (I assume it’s Type 2). As it stands, you’re perpetuating two myths: one, that all types of diabetes are affected by “poverty rates, access to health care, and nutritional differences” (Type 1 is an autoimmune disease and has nothing to do with lifestyle), and two, that only children are diagnosed with (or have) Type 1 diabetes.
Here’s a problem: neither the CDCP nor the Salon Slate article specify. They say “adult diabetes,” meaning individuals over the age of 18 who are diagnosed with diabetes (so not necessarily adult onset diabetes). I think that would mean either Type 1 or Type 2. But I’d take the data with a little caution since the source doesn’t make that absolutely clear.
UPDATE 2: Chris points out an important element of what might be going on here:
More significantly one of the comments on Slate (not Salon) said that the diagnostic standard for diabetes recently dropped from 140 to 124. That’s going to add a LOT of people to the second map if the transition occurred between 2004 and 2008.
That would make a lot of sense, because quite honestly, I just couldn’t figure out how the overall numbers had increased so rapidly in just 4 years. This is a great example of the social construction of health and disease: we are constantly defining and redefining what does and doesn’t count as unhealthy, which can dramatically affect statistics on the topic without there necessarily being a large change in the overall state of the population.
Comments 20
Lisa — November 30, 2010
Not surprisingly, that looks almost exactly like the obesity map.
Arielle — November 30, 2010
Please clarify the type of diabetes this graph is discussing (I assume it's Type 2). As it stands, you're perpetuating two myths: one, that all types of diabetes are affected by "poverty rates, access to health care, and nutritional differences" (Type 1 is an autoimmune disease and has nothing to do with lifestyle), and two, that only children are diagnosed with (or have) Type 1 diabetes.
jfruh — November 30, 2010
It would be great to correlate these against a host of other data. For instance, the dark arc through the south (more visible in the first map than the second) correlates pretty well with the "Black Belt," the ring of deep south counties that have been majority black since the Civil War. Some of the outlying clumps of high diabetes numbers (Montana, the Dakotas, Arizona) are in counties that overlap with Indian reservations. And then there's the less dramatic dark belt along the W.Va/Ohio border -- poor white Appalachia.
Chris — November 30, 2010
I find it odd that I can pick out so many state borders. Perhaps there's a selection bias in the data collection by state?
More significantly one of the comments on Slate (not Salon) said that the diagnostic standard for diabetes recently dropped from 140 to 124. That's going to add a LOT of people to the second map if the transition occurred between 2004 and 2008.
There's a similar phenomena with adult obesity rates as measured by BMI. It used to be 27 for men, then it was dropped to 25. I don't recall the change for women. Overnight millions of people became statistically overweight or obese.
Uly — November 30, 2010
That would make a lot of sense, because quite honestly, I just couldn’t figure out how the overall numbers had increased so rapidly in just 4 years.
Something similar goes on when talking about autism diagnoses. In the early 90s, a number of things happened: the diagnostic criteria for autism became "easier" (and many children who would have been diagnosed as mentally retarded or as childhood schizophrenic now get an autism diagnosis instead), Asperger's entered the DSM (more diagnoses of kids and adults who would not have gotten one just 30 years ago), reporting of autism became more standardized through the nation, people began talking about the concept of autism as a spectrum and diagnoses such as PDD-NOS and HFA became more common, and, in general, there was a great increase in awareness of autism both among diagnosticians and parents.
Any one of these would increase the number of reported diagnoses. All of them in such a short time frame was bound to. The most generous result of this I can say is that it's not possible to tell if actual cases of autism have increased.
Of course, there are always some who are firmly convinced that the numbers actually jumped from 1 in 10,000 to 1 in 166 in just a decade. (Please!)
Ruth — November 30, 2010
Hmm a massive increase in diagnosis-millions of americans live with type 2 diabetes without knowing it and if the borders have been changed down even a very small amount, many people who would previously scored "prediabetic" will now have a diagnosis of diabetes instead. Also there is a push at the moment towards diagnosing diabetes earlier- as it has such major, slowly accruing irrevesible damage, the earlier you diagnose the better- and this is becoming more and more obvious with recent research. This encourages primary care physicians to test people who might otherwise have been "ah leave it test in a few years". Actual people with diabetes has increased in that time, but diagnoses have leapt.
Sheena Roetman — November 30, 2010
I'd like to point out that that odd, kind of lonely and extremely dark spot up around Minnesota and North & South Dakota is Pine Ridge Reservation. In fact, most of the darker spots in the north-western part of the country are Native reservations.
ericaceous — December 1, 2010
Aging is another thing that is important here. If we live long enough, most of us will get diabetes eventually (even if it's not until we are 95). It's possible that some age-risk threshold was reached for some baby boomers during this time period. Furthermore, many people without insurance avoid routine medical care until they are eligible for medicare. It might be useful to try to tease out whether there's some kind of age cohort effect for thos who turned 65 in this time period.
Rabbit — December 1, 2010
On the Alaska portion of the map, I notice that the lowest rates of diabetes (orange and yellow) correspond to the most highly populated portions of the state (central interior, southeast panhandle). It is also interesting to note that this is where most of the white/non-AK Native population lives. The highest rates of diabetes appear to occur in the villages (especially the Aleutian Islands and the far north). This suggests that diabetes is a huge problem for the Native communities here, which is true. It may or may not be interesting to note that these areas are also highly isolated, and in the winter some of them are completely cut off.