
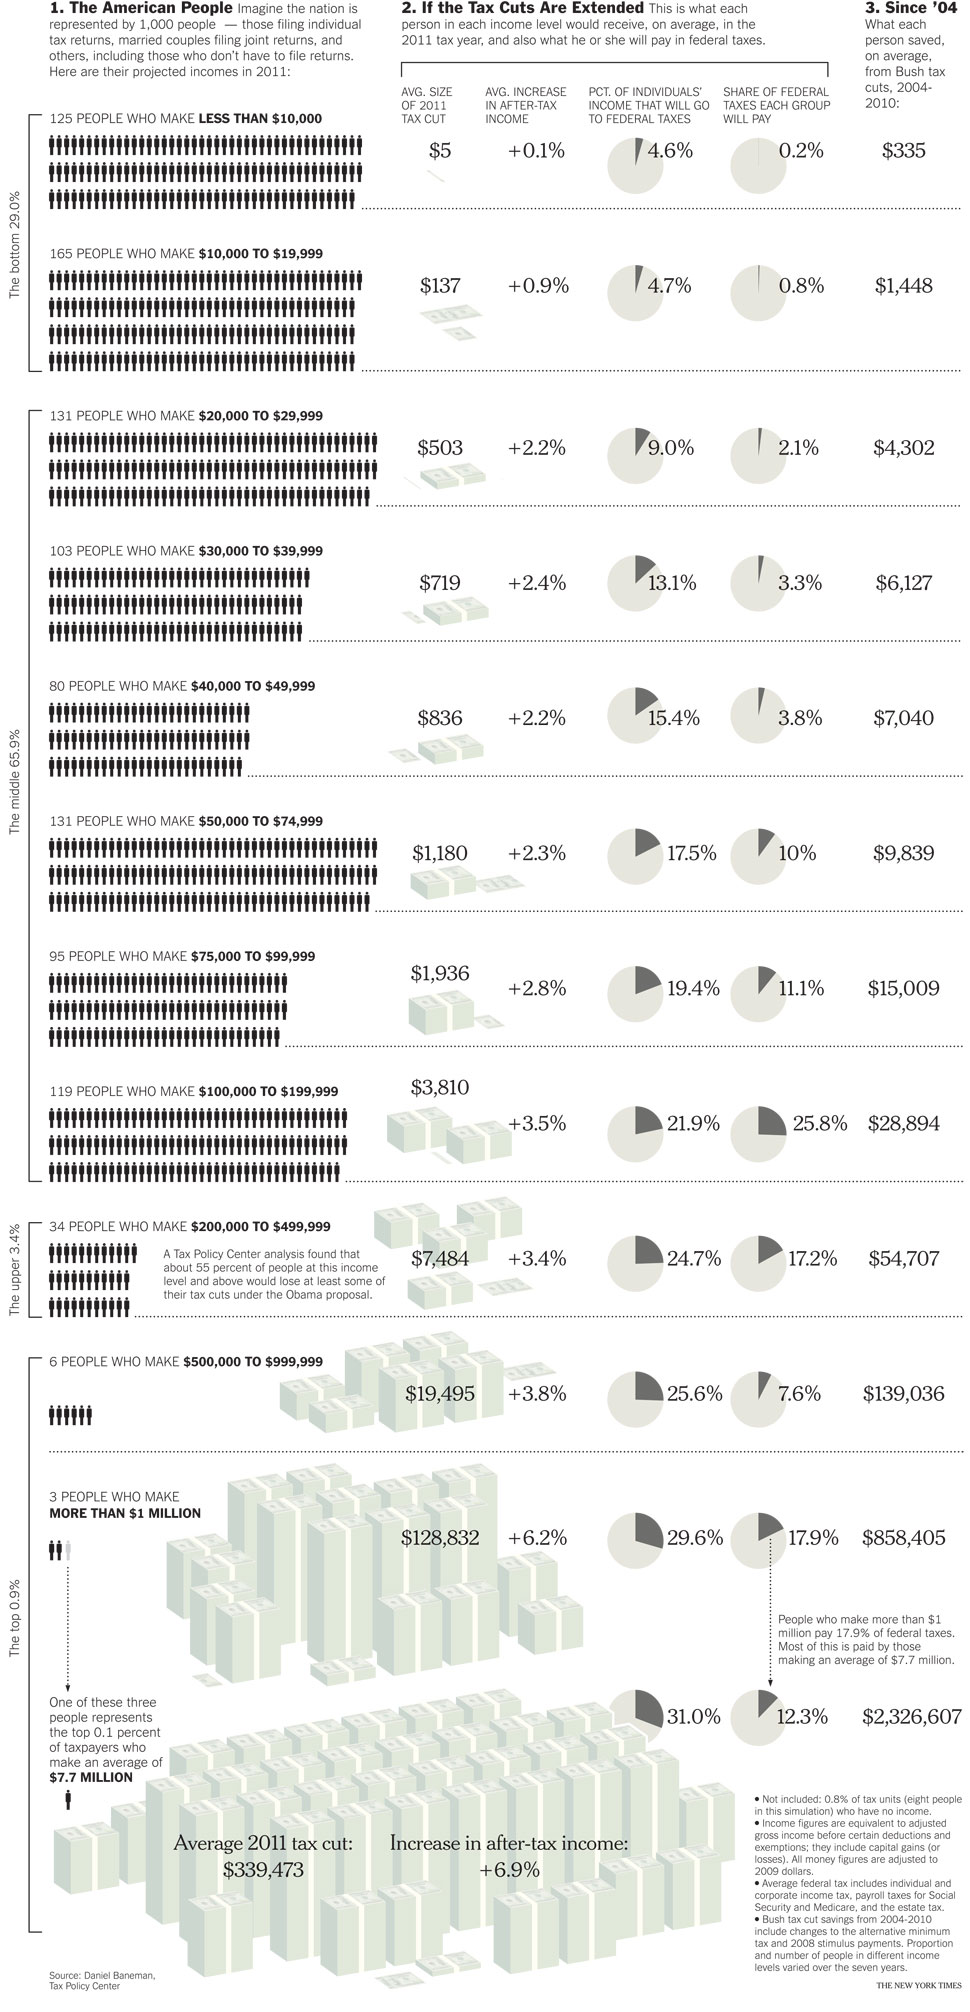
American politicians are currently wrangling over whether to extend the Bush tax cuts of 2001 and 2003. Word on the street is that extending these cuts will cost the U.S. treasury $2.7 trillion over the next ten years. A graphic from the New York Times shows how much people with different incomes benefited from these tax cuts. If you look at the far right column you’ll see the average number of dollars left in people’s pockets between 2004 and 2010; the dollar amount rises from the poorest 29% of Americans (top with $355) to the richest 1% (bottom with $2,326,607).
Click over for a larger image; via BoingBoing.
—————————
Lisa Wade is a professor of sociology at Occidental College. You can follow her on Twitter and Facebook.
Comments 9
b — September 28, 2010
A few other things this makes clear, if you read more than just the rightmost column:
- The top .9% of people will still pay 25.5% of all federal taxes.
- The bottom 29% will still pay only 1% of all federal taxes.
- The percent of a person's income that goes to federal taxes still rises steadily at every point.
- The top .9% got about twice the percentage income increase as the middle class.
jane — September 28, 2010
The wealthy are often benefactors to universities, the arts, and valuable charitable organizations. Tax deductions for charitable giving provide an important incentive to participate, and I don't think it would be wise to do away with it. My non-profit squeaks by with a few hundred thousand per year... I'm not sure we would make it without tax-exempt status. True, though, there are other non-profit organizations that I could do without... AND the wealthy are far more likely to not pay their taxes in full. Easy for me to say of course; not like I could salvage millions of dollars by cheating on my taxes.
I think your best point here, and one that gets absolutely no attention whatsoever, is the regressive nature of the sales taxes. Doing away with this system is something anyone from a socialist to a libertarian could agree on... yet policy makers ignore it entirely. In my city of Chicago we have a 10.75% sales tax, and unlike many other cities, food and clothing are not exempt. WHAT THE WHAT?! The poor disproportionally bear the burden of this!
rose — September 29, 2010
just because people have wealth, they are not always donors to non profits. many invest in themselves. they take risks in the stock market and other types of gambling. if they win, they are more wealthy, if they lose they often can use that to reduce their taxes. it does not spread to the rest of us. wealthy people have access to better financial advisors, to lawyers and to bankruptcy.
angelica — September 29, 2010
There are a few other things this doesn't really show:
1. As mercurianferret and jane touch on above, it's talking very strictly about income taxes. That "% of individuals' income that will go to federal taxes"? Pretty worthless beyond a very narrow focus. When all taxes other than income tax are taken into account, the US tax system is deeply regressive: the poor pay a much higher percentage of their income and wealth in tax than do the rich.
2. Moreover, despite the occasional bare-minimum social program, tax dollars go massively disproportionately to those at the top of the wealth scale. As an aside, this adds a different spin to the unusually strong popularity of anti-tax sentiment in the US. Many liberal types express frustration at what they see as huge numbers of people voting against their interests. However, the effect of the US tax system is in practice a massive scale redistribution of wealth from the poor to the rich, with the majority of spending going towards things which do not benefit the majority of the people. Sure, in practice the Republicans are going to make this even worse and the tax cuts they talk about are actually mostly for the super-rich, but particularly given that the Democrats have little record of making it better, is it really that surprising when so many people vote for the people shouting loudest about taxes?
3. The natural inclination of capitalism is to exacerbate the gap between the rich and the poor. Whilst I'd rather like abolition rather than reform, if yr looking at structures within the current system, a very heavily progressive tax system indeed is needed to prevent the wealth gap growing exponentially. If you look at this gap historically in the US, even the strongest tax policies of the past barely prevented this tendency, whilst if you look at the neoliberal policies of the past few decades, it has lead to an explosion of the gap, with the poorest people actually less well off than pre-Regan, despite any overall economic growth and even before taking into account the drastic attacks on the already-weak US welfare state during this time.
shorelines — September 30, 2010
Slate.com's Timothy Noah has done an excellent series this month on income inequality in the US.
http://www.slate.com/id/2266025/entry/2266026/
and
http://www.slate.com/id/2268872/
and
http://www.slate.com/id/2268981/
Check out the discussions too. Fascinating stuff.
Sarah — November 23, 2010
I know this is an older post, but I have to say this. Whatever higher taxes are charged to those at the top of the heap, all they will do is turn around and charge the rest of us more money for the goods/services their companies provide so that we can pay those taxes for them. That's it. Full stop.