Notes from north of 49ºN
In the Twittersphere, this Ottawa Citizen article on green stimulus has been going around, based on a forthcoming UN report. While 15% of the $3.1T in global stimulus investments are green, Canada, under the leadership of Prime Minister Stephen Harper is lagging behind {See data below the jump}, barely in the top 10 in amount spent and percentage of green stimulus. South Korea is leading the way, in terms of both amount spent and percent of stimulus spending, while the US is third in total green stimulus spending. Not surprising, given news reports up in Canada::
“A common theme, though, appears to be a series of delays in approvals and disbursements, with less than one-quarter likely to be spent in 2009.”
The UN report recommends that G20 countries increase the rates of investments in green infrastructure and stimulus. Five key areas for focus were identified::
- energy efficiency in old and new buildings
- renewable energy technologies such as wind power
- sustainable transport technologies such as hybrid vehicles or high-speed rail
- global ecological infrastructure such as forests
- sustainable agriculture
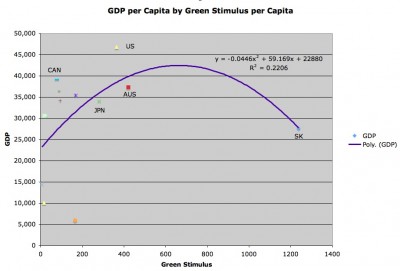
I haven’t crunched any numbers, but looking at the list, I think there’s an interaction effect with policy support of green initiatives and clusterings of firms with green innovation strategies. One of the questions I had is whether, thus far, is the idea that “green” is viewed as a luxury. While imperfect, I wanted to see the relationship between richer nations {higher GDP per capita} and investment in green stimulus {per capita}. I crunched these numbers (below the jump, with the GDP data taken from the IMF 2008 data}. While there are not enough data points to make strong inferences about the data relationship, the following graph tells a story. South Korea skews the curve::

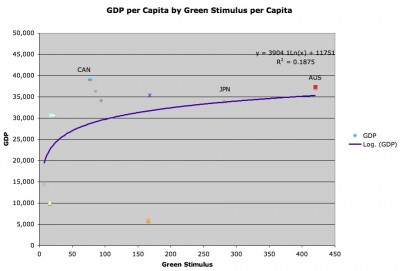
Taking the US & South Korea out, increases in green stimulus increases at a decreasing rate with respect to higher levels of GDP::

So, looking at the data, South Korea and China are investing in green technologies, despite having lower average national incomes. It would be interesting to monitor which technologies are being invested in the various countries and track the outcomes. Canada should heed what’s going on, as they try to shift towards innovation and away from natural resource extraction.
Twitterversion:: #PMHarper’s #Canada lagging #G20 in green stimulus innov. spendng. Richer tend2 spend+, but China& S.Korea making a play. http://url.ie/2ihx @Prof_K
Song:: Everythings Gone Green (Edit) – New Order
Tale of the Green Stimulus Tape
Percentage of stimulus dedicated to green spending:
1. South Korea 79%
2. China 34%
3.Australia 21%
4. France 18%
5. Britain 17%
6. Germany 13%
7. United States 12%
8. South Africa 11%
9. Mexico 10%
10. Canada 8%
11. Spain 6%
12. Japan 6%
13. Italy 1%
Green stimulus per capita:
(U.S. dollars)
1. South Korea $1,238
2. Australia $420
3. United States $365
4. Japan $282
5. Germany $168
6. China $166
7. France $94
8. Britain $84
9. Canada $77
10. Italy $22
11. Spain $18
12. South Africa $16
13. Mexico $7
| Nation
South Korea |
Green Stimulus per capita
1238 |
GDP per capita
27,647 |
| Australia | 420 | 37,299 |
| US | 365 | 46,859 |
| Japan | 282 | 34,100 |
| Germany | 168 | 35,442 |
| China | 166 | 5,963 |
| Frence | 94 | 34,208 |
| UK | 84 | 36,523 |
| Canada | 77 | 39,183 |
| Italy | 22 | 30,581 |
| Spain | 18 | 30,621 |
| South Africa | 16 | 10,119 |
| México | 7 | 14,560 |

Comments