
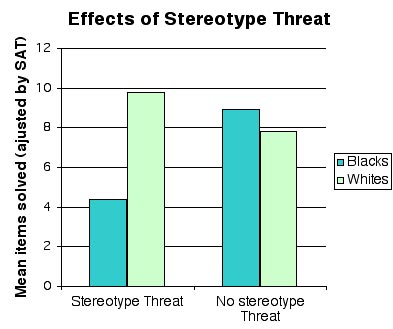
Stereotype threat: The difference in performance measured when the belief that people like you (blacks, women, etc) are worse at a particular task than the comparison group (whites, men, etc) is made salient.
The left side of the bar graph is the performance of blacks and whites on a task (on which whites are stereotypically believed to be superior) when stereotype threat is activated (blacks and whites are reminded of the stereotype in some way). The right side of the bar graph is the performance of blacks and whites on the same task when the stereotype remains unactivated. Note the remarkable difference. This demonstrates the ways in which stereotypes, when made salient, affect our performances on “objective” tests.
From: The Effects of Stereotype Threat on the Standardized Test Performance of College Students by J Aronson, CM Steelel, MF Salinas, MJ Lustina. In Readings About the Social Animal, 8th edition, edited by E. Aronson. Stolen from Wikipedia.