
OKCupid, an online matchmaking site, offers data on gender and perceived attractiveness that I might use in my spring deviance course (via boing). The figures might help me make a Durkheimian society of (hot) saints point about the relative nature of beauty and a Goffman point on stigma affecting social interaction, while providing another illustration of the taken-for-grantedness of heteronormativity.
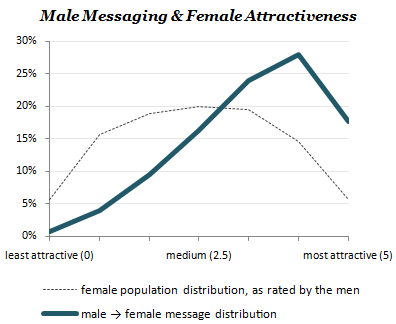
In any case, the first figure shows that male OKCupid ratings of female OKCupid users follows something like a normal distribution, with mean=2.5 on a 0-to-5 scale from “least attractive” to “most attractive.” Also, women rated as more attractive tend to get more messages. At first, I thought I saw evidence of positive deviance here, since women rated as most attractive get fewer messages than those rated somewhat below them — the 4.5s garner more attention than the 5.0s. But, as I’ll show below with the next chart, that would probably be an incorrect interpretation — confounding the “persons” in the dashed lines with the “messages” in the solid lines.
The next figure shows that female OKCupid users tend to rate most male OKCupid users as well below “medium” in attractiveness. According to OKCupid, “women rate an incredible 80% of guys as worse-looking than medium. Very harsh. On the other hand, when it comes to actual messaging, women shift their expectations only just slightly ahead of the curve, which is a healthier pattern than guys’ pursuing the all-but-unattainable.”
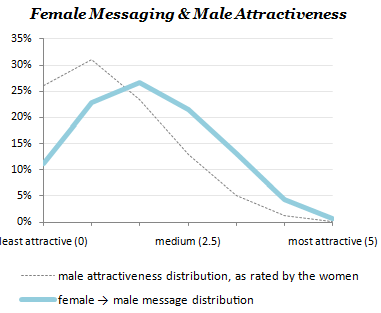
Hmm. The latter point isn’t wrong, I guess, but it shouldn’t obscure the bigger point that more attractive men still get more messages than less attractive men. Again, note that persons (OKCupid members) are the units of analysis for the dashed lines and messages (messages sent by OKCupid members) are the units for the solid lines. On first scan, I read the graph as suggesting that the top “attractiveness quintile” was getting fewer messages than the bottom attractiveness quintile — that uglier men were actually doing better than more attractive men — but that’s not the case at all. Instead, it just means that in the land of the hideous, the somewhat-less-than-loathsome man is king.
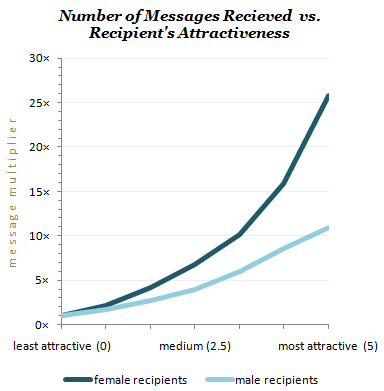
If almost everybody is rated as unattractive, most of the messages will go to those rated as unattractive. Nevertheless, the rate of messages-per-person still rises monotonically with attractiveness. As the “message multiplier” chart below shows, the most attractive men get about 11 times the messages of the least attractive men — and the most attractive women get about 25 times the messages of the least attractive women.
—————————
Chris Uggen is Distinguished McKnight Professor and Chair of Sociology at the University of Minnesota. His writing appears in American Sociological Review, American Journal of Sociology, Criminology, and Law & Society Review and in media such as the New York Times, The Economist, and NPR. With Jeff Manza, he wrote Locked Out: Felon Disenfranchisement and American Democracy.
If you would like to write a post for Sociological Images, please see our Guidelines for Guest Bloggers.
Comments 12
larry c wilson — December 3, 2009
Attractiveness is in the eye of the beholder.
The Nerd — December 3, 2009
What this leaves out is that on OKCupid, when someone rates someone else as a 4 or a 5, and that person happens to also rate them 4 or 5 as well, then they're both alerted to that fact. I suspect that women are less likely to want a man to be receive the "you both gave each other a high rating for looks" message, lest he see that as an invitation to solicit her for sex. I personally hesitate to rate anyone higher than 3 in looks unless I'm absolutely certain I wouldn't mind being contacted by him, so what he writes in his profile is also a factor in my rating(or else he's amazingly gorgeous).
Michelle — December 3, 2009
Very interesting! I do second The Nerd's comment, though. Rating someone a 4 or 5 is an invitation to be contacted.
Also, OKC used to break out rating by attractiveness and personality (or something? I can't remember how they worded it). Now the rating is one for the entire profile.
I'd read the original post on OKC and I'm still not clear on exactly what data they're using. If they're using the new, streamlined ratings - which admittedly are likely to be dominated by looks, but aren't exclusively about looks - the analysis gets pretty muddy.
it's a love thing — December 3, 2009
Excellent post, thank you Lisa and Dr. Uggen.
Holly — December 3, 2009
I'm an OKC user, and yes, they used to have 2 ratings: a "looks" and "personality" one. Now it is just one general rating. So when I rate a guy, it isn't just on physical attractiveness alone, but also if I'm attracted to him in other ways. I find that compared to other dating sites I have used, OKC seems to be a hangout for disaffected youth, the SCA renaissance men, pretentious grad students who attempt to sound intelligent by using every word from their GRE booklets, and emo boys who write poetry and watch a lot of french films. So most guys don't get a 4 or 5 rating from me.
Meems — December 3, 2009
I was going to say what Holly said - this data is misleading because the ratings are not just on looks. I have to look at factors other than looks to know how I'm going to rate someone (age, height, personal description, etc.)
Patrick — December 3, 2009
I'm not sure that the 'average responses per rating per gender' chart says anything meaningful without an idea of total amount of users per gender. If there are significantly more men than women on the site (that seems to be a safe assumption but I'm not going to make it) then a large differential at the upper ends strikes me as .. what I would expect.
Of course there's also the question of how gendered these interactions are; as some users have already pointed out they will rarely rate a man a 4 or 5 unless they're sure they want to be contacted by them. That seems like a really unfortunate feature on the part of OKCupid; you'd think they'd leave that as opt-in (or opt-out might be better from a business standpoint) feature. But it's also telling and not disclosing this (or realizing it) as part of this article is an unfortunate lapse. Good thing people spoke out I guess :)
chocolatepie — December 3, 2009
The heteronormative basis of this data is kind of shocking in view of the fact that OKC allows same-sex searches. I would like to see data for men messaging men and women messaging women as well before any overarching gender trends are proposed.
Plus, women are more likely to rate themselves accurately in attractiveness and men are more likely to rate themselves as more attractive than they actually are (see here) . Since people tend to go after partners that are around or slightly below their perceived level of attractiveness, women's lower self-ratings will influence their message rate.
Furthermore, the least attractive women will be reluctant to participate in online dating at all, if they deem themselves off the scale, but the least attractive men will rate themselves as slightly higher, putting more of them into the pool.
Chris — December 4, 2009
Great comments here -- thanks Gwen and Lisa. OKCupid didn't say much about the sampling frame, so I left that out of the post. Like the commenters, I'll likely use this in my heteronormativity lecture and try to start a discussion around the notion of beauty standards. Many thanks
Deborah — December 7, 2009
I have to wonder, also, if even rating a photo 'attractive' isn't a highly variable thing. I rate a photo (not personality, mind you, just photo) as attractive based on things other than purely physical attributes. Something in the eyes that seems kind, or fun, or funny. It's not a beauty contest to me. So I wonder, if people actually rated photos differently based on "physical attractiveness" versus "personal appeal" or "likability," how would that change things?
kdlmn — July 19, 2012
As a new Ok cupid person: This post makes so much more sense to me now... First of all: Overall I would say that Ok cupid users are less attractive than the average people I might (who might then be in a relationship). Almost no attractive people of either gender seem to be on the page. And I have been nothing but shocked by the guys messaging me so far: Apparently none of them have ever used a mirror or simply believe that women are not attractive. This is closer to 'bar situations'. I never tend to be baffled by the guys who think they have a chance. [I'm looking mostly for women on okc anyways and have been a member for 3 days.]