Cross-posted at Ms.

Previously we’ve posted on the sexy makeovers recently given to Dora the Explorer, Strawberry Shortcake, Holly Hobby, Lisa Frank, Trolls, Cabbage Patch Kids, and the Sun Maid.  Here we have three more.

My Little Pony

The original My Little Pony, chubby and adorable (source):

Today they’re thinner, with an open mouth, more provocative stances, and more responsive positions (source):

Rainbow Brite

Vintage Rainbow Brite:

Rainbow Brite today:

Finally, Monika alerted us to the new look for Candy Land.  First, vintage Candy Land.

1949:


1955:


1962 Candy Land book:

2005:

From the website of Candy Land today:

Lisa Wade, PhD is an Associate Professor at Tulane University. She is the author of American Hookup, a book about college sexual culture; a textbook about gender; and a forthcoming introductory text: Terrible Magnificent Sociology. You can follow her on Twitter and Instagram.

Alex W. sent in a 1972 ad for Weyenberg Massagic shoes (a version of which was reprinted in Ms. magazine in 1974, after appearing in Playboy). The ad uses subtle imagery and text to imply that if men buy the right footwear, women will be so entranced that they will remain in their natural habitat, the floor (more specifically, as reader Jamie points out, at your feet), just for the chance to gaze at the beautiful product:

Michael Konczal summarizes a depressing story for today’s unemployed and all of us in nations hardest hit by the current recession (via ginandtacos).

Till von Wachter, Jae Song and Joyce Manchester show that unemployment’s negative effect on your pocketbook persists long after re-employment. The figure below shows what happened to the incomes of people who did and did not lose their job during the 1982 recession. It shows that those that lost their jobs (the grey line) saw a decrease in earnings that has yet to recover. Controlling for inflation, on average the unemployed make less now than they did before they lost their jobs 20 years ago.

Quotes Konczal:

…the net loss to a displaced worker with six years of job tenure is approximately $164,000, which exceeds 20 percent of the average lifetime earnings of these workers. These future earnings losses dwarf the losses associated from the period of unemployment itself.

This same pattern can be found at the society level. Michael Greenstone and Adam Looney made the same comparison across countries that were hit the hardest by the recession (purple line) and countries hit less hard (green line). The incomes of individuals in the hardest hit nations were harmed long-term:

Greenstone and Looney show the same pattern for the unemployment rate:

Lisa Wade, PhD is an Associate Professor at Tulane University. She is the author of American Hookup, a book about college sexual culture; a textbook about gender; and a forthcoming introductory text: Terrible Magnificent Sociology. You can follow her on Twitter and Instagram.

Tim Wise answers just this question in this 2 1/2 minute clip featured on his website.  Sneak peak: His answer begins with “No. You should feel angry.”

Laurie J graciously pasted the transcript in the comments; I’ve added it after the jump.

more...

To provide a little context to the current discussion about extending the Bush-era tax cuts, the New York Times has an interesting graph up that shows changes in the level at which the top tax bracket kicked in, as well as the % tax rate in the top bracket:
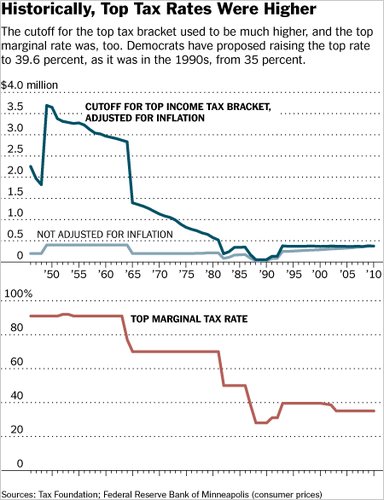
So on the one hand, in constant dollars, you used to have to be quite a bit richer before you hit the top marginal tax bracket, because we had a wider range of brackets and differentiated incomes more than we do now (taxing an income of $500,000 differently than one of $5 million, whereas now we’ve basically collapsed all those brackets). But now, the highest income tax rate is well under half of what it was in the ’50s.

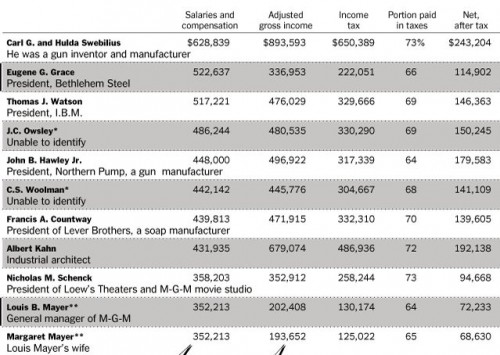
This chart shows the incomes and tax levels of the 10 Americans with the highest salaries (as opposed to wealth from investments, capital gains, etc.) in 1941, data we have because in 1943 President Roosevelt asked for a report on top earners:
I keep hearing news organizations discuss the existing tax cuts, and their possible extension, in a way that seems a bit confusing, by saying it’s a tax cut for people making “up to” $250,000, or $500,000, or however much the cap is for the different plans being thrown around. That seems to imply that, say, everyone making $250,000 or less gets a tax cut, and anyone making $250,001 gets nothing at all. Just to clarify, under all these plans, everyone would receive (or, more accurately, keep the existing) cut on their first $250,000 (or whatever the chosen cutoff would be).

At issue is whether that same tax rate should apply to all income, or whether beyond a chosen cutoff, the Bush tax cuts would expire. In that case, if you made $300,000, say, you would keep the tax cuts on your first $250,000 in income (and thus pay roughly 35% in taxes), but pay a higher rate on that last $50,000 (about 39%). You wouldn’t pay the higher tax rate on your entire income. And I think that’s getting lost a bit in the use of phrases like “middle class tax cuts” or “tax cuts up to X dollars.” That’s separate from whether or not you think extending the tax cuts are a good idea, but I just wanted to take a second to clarify what I think is an easily misunderstood point, made worse by the way it’s being reported on.

Philip Cohen, at Family Inequality, posted an interesting graph displaying 30-44-year-old women’s share of their household’s income by level of education:

The graph shows that, on average, women with higher levels of education have incomes closer to that of their husbands than women with lower levels of education.  Cohen writes:

It captures nicely both how women’s earning power within married couples has increased, and how that shift has been much greater for women with higher education.

In other words, the figure suggests that efforts to close the wage gap between men and women have been much more successful at the top of the economic ladder than the bottom.

Lisa Wade, PhD is an Associate Professor at Tulane University. She is the author of American Hookup, a book about college sexual culture; a textbook about gender; and a forthcoming introductory text: Terrible Magnificent Sociology. You can follow her on Twitter and Instagram.


For years biologists, anthropologists, and sociologists have all agreed that racial categories are social constructs.  Recently, however, new genetic information about human evolution has required that scientists re-think the biological reality of race.  In this 6-minute video, sociologist Alondra Nelson describes this re-thinking:

Lisa Wade, PhD is an Associate Professor at Tulane University. She is the author of American Hookup, a book about college sexual culture; a textbook about gender; and a forthcoming introductory text: Terrible Magnificent Sociology. You can follow her on Twitter and Instagram.

Abi, a professor of Materials Engineering at the Indian Institute of Science, pointed out an interesting graph posted by Ezra Klein at the Washington Post. The graph, using data from a survey of public opinion about the U.S. budget, shows how much of the U.S. budget respondents believe goes to foreign aid, how much they think should go to foreign aid…and how much actually does:

The actual figure? 0.6% in 2009.