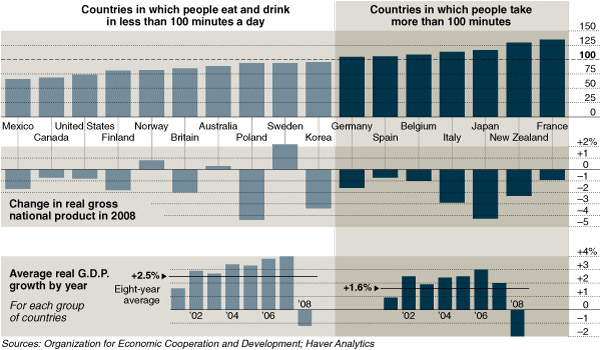
Using the same OECD data set that produced this graph on time spent eating and BMI, Floyd Norris at the New York Times brings us a new finding. The “10 countries where people spend less than 100 minutes eating and drinking each day have, as a group, consistently shown higher economic growth than those that took more than 100 minutes to savor their daily repasts.”
 As before, the statistics are far from conclusive, but the data continues to invite a discussion about food and culture.
It also invites a discussion of atheoretical data analysis. Last year, Chris Anderson’s article in Wired Magazine (The End of Theory: The Data Deluge Makes the Scientific Method Obsolete) argued that our ability to generate vast amounts of data, made theory unnecessary, and that scientists were starting to look at correlations as a sufficient analysis level of analysis.

Comments 5
Elena — May 11, 2009
"As a group"? Compare the GNP variations of Japan and Poland, or Spain and the USA, and try to predict which countries go for slow food and which ones for fast food. The in-group variation is too high in respect to the variation between groups for anyone to be able to get any meaningful trend out of this graph.
Jeannie — May 11, 2009
Besides, I'll continue eating my food "slowly" because it's healthier anyway (hollah to Alice Waters!).
-proud Californian
David A — May 11, 2009
taking a short time to eat is associated with eating out more often (especially at fast food restaurants) and therefore while it may add more value to the economy it certainly has other things associated with it as well.
Keith — May 12, 2009
Are these things actually related? Correlation does not always indicate causation, and even so, these graphs don't seem to match up that well anyways.
SabinaHolt — March 13, 2024
Feel free about knowing something new on solar energy, solar power and, of course, solar panels levantsolarenergy.com