The Federal Reserve has announced that it is holding off on an interest rate hike; the last time it raised rates was in 2006. The reason for the lack of action: the Federal Reserve believes the economy remains fragile and, since inflation remains low, it doesn’t want to do anything that might bring the expansion to a halt.
In reality our economic problems go much deeper than slow growth and economic fragility. Bluntly said, most workers are losing ground regardless of whether the economy is in recession or expansion.
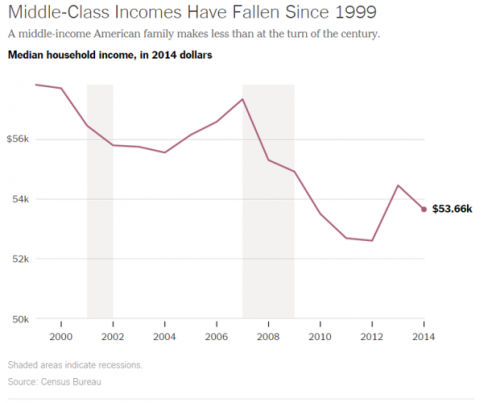
The following chart, from a New York Times article, shows the movement in real, inflation adjusted, median household income from 1999 to 2014.
The median household income was $53,657 in 2014. That was 1.5 percent below what it was in 2013. Perhaps even more disturbing, as the Times article notes:
The 2014 real median income number is 6.5 percent below its 2007, pre-crisis level. It is 7.2 percent below the number in 1999.
A middle-income American family, in other words, makes substantially less money in inflation-adjusted terms than it did 15 years ago. And there is no evidence that is reversing…
The depressing data on middle-class wages is true across almost all groups based on race and age. (One exception is a 5.3 percent gain in median wages among Hispanics in 2014, though that is within the statistical margin of error and so may not be meaningful).
And there is good reason for believing that things are unlikely to improve in the near future. As a recent study by the National Employment Law Project makes clears, real wages are continuing to fall for most workers.
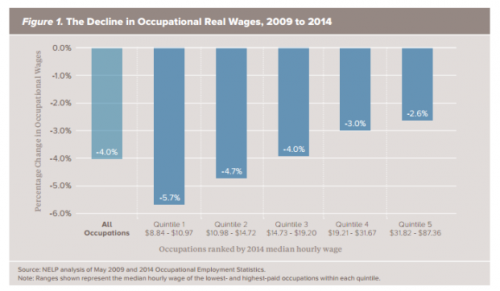
The authors of the National Employment Law Project study “calculated the percentage change in real median hourly wages from 2009 to 2014 for 785 occupations, which were grouped into quintiles, each representing approximately one-fifth of total employment in 2014.” Figure 1 shows the change in real wages for each of the five quintiles over the period. As we can see, real median hourly wages fell across the board, with the overall median wage falling by 4 percent.
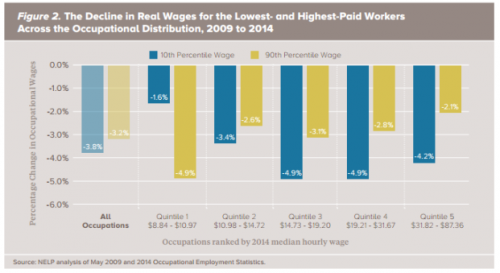
Figure 2 keeps the same wage groupings but shows the change in wages for both the highest (90th percentile) and lowest (10th percentile) earners in each wage quintile. As we can see, with the exception of occupations in the lowest paid quintile, the fall in wages was greater for those in the bottom percentile than for those in the top percentile. That said, the most striking fact is that all suffered declines in real wages.
Steady as she goes, which seems to be the strategy of most policy-makers, is unlikely to turn things around.
Originally posted at Reports from the Economic Front.
Martin Hart-Landsberg is a professor of economics at Lewis and Clark College. You can follow him at Reports from the Economic Front.


Comments 3
Bill R — September 22, 2015
Globalization and the natural growth orientation that accompanies it has permanently changed the nature of the middle class in the US. Able high school educated workers in 2014 had half the income and double the unemployment rate of college educated workers. Over time, workers will need more than a BS to prosper. You can swing that hammer and sickle but they're not going to put you in the middle of anything anymore.
photing — October 30, 2025
In reality our economic problems go much deeper AI Photo Editing than slow growth and economic fragility
whitley — November 19, 2025
Great new for solitaired