The National Bureau of Economic Research recently released a paper by Emin Dinlersoz and Jeremy Greenwood about unionization in the U.S.. They argue that economic shifts that changed the relative prevalence of different types of occupations partially explain decreasing union membership.
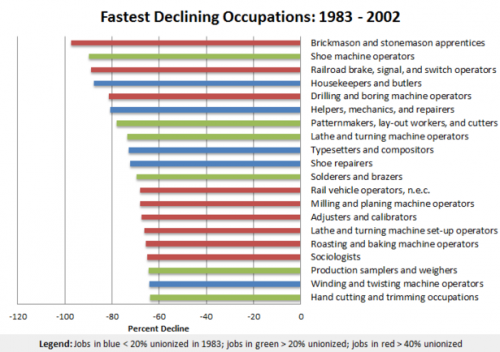
So what occupations are growing, and which are declining? Jordan Weissmann, at The Atlantic, adapted two graphs from the NBER paper that illustrate larger economic changes. Of the twenty fastest-declining occupations (in terms of % decrease), many are factory or industrial production jobs — machine operators of various types fare especially poorly (also, sorry, fellow sociologists):
The color of the graph indicates the level of unionization for each occupation; blue = less than 20%, green = 20-40%, red = over 40%. Nine of these occupations were over 40% unionized; their decline means the loss of many decently-paid jobs that provided benefits to employees without high levels of formal education.
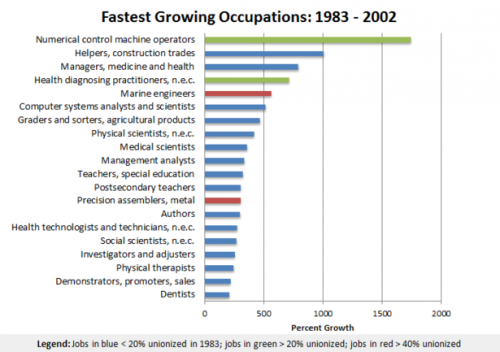
So which occupations are growing, then? Take a look (though note this reflect % change, not overall # of employees):
Notice that top category: numerical control machine operators. Those words reflect a profound shift in manufacturing in the U.S. Numerical control machine operators program and operate computerized machinery, which requires a very different type of human operation than the classic assembly line machinery did — less input of physical labor and more technical management and troubleshooting.
Many of the other fastest-growing occupations require specialized, and often lengthy, higher education or licensing: health-diagnosing practitioners, teachers, scientists, physical therapists, and dentists, for instance. And unionization is consistently low in these types of occupations, contributing to overall declines in the prominence of unions in the U.S. over time.


Comments 13
Majromax — May 17, 2012
machine operators of various types fare especially poorly (also, sorry, fellow sociologists):
That sociology one confuses me. Does it reflect a bona-fide drop in the number of sociologists, or does it reflect a recategorization of the same type of work into another field, like specialized branches of psychology or economics?
Soc Guy — May 17, 2012
Doesn't it seem weird that Sociologists are in with all of
these manual trades? It should, and yet no one’s asking the right question; instead, we’re
looking for substantive and interpretive reasons.
Simply: THE DATA ARE WRONG. Like a good little sociologist,
I went to the source (http://www.unionstats.com/) and looked at the data
(scroll down to Table V., look for COC 168). Compare the rates of
Sociologists in 2001 (3,265), 2002 (384 - the data used in the paper) and 2003
(4,221). In 2002, it's off by a factor of 10. Did such a dramatic change in occupation
really happen in only one year? Obviously a misprint. Probably supposed to be 3,840.
Rather than declining 65%, sociologists have actually grown about 250% in this period. Congratulations, fellow sociologists!
I was taught that when you have an anomalous data result (like, oh I don't know, sociologists listed between "roasting and baking machine operators" and "Production samplers and weighers") that you should go back and check the data and coding for errors. I guess economists aren't taught that...
Fastest shrinking and growing occupations « Introduction to Sociology — June 8, 2012
[...] Source: Gwen Sharp at Sociological Images [...]