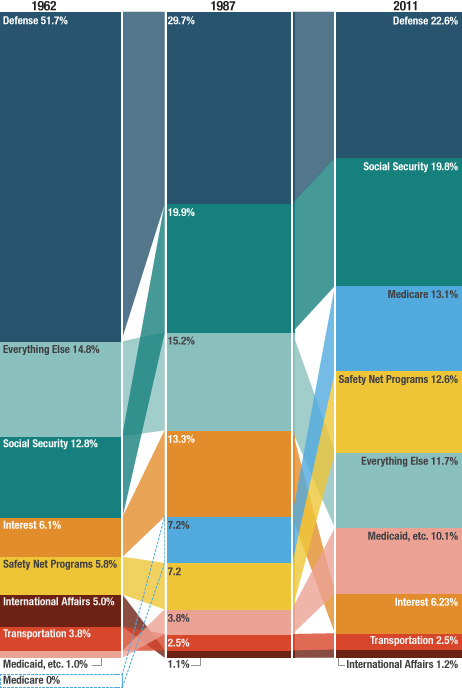
NPR’s Planet Money blog posted this image showing changes in major categories of federal spending over the past 50 years. Notably, though defense spending (which includes veteran benefits) is still the largest category of federal spending, it’s a much smaller proportion of the total budget than it was in the ’60s; spending on interest on our debt has also fallen quite a bit since the ’80s. On the other hand, spending on Social Security, Medicare and Medicaid (which didn’t even exist in 1962), and safety net programs (including food stamps and unemployment) have grown. The somewhat reduced “everything else” category includes everything from education to space exploration to agriculture and more:
Via The Sociological Cinema; data available at the Office of Management and Budget.


Comments 10
Allison — May 16, 2012
It's hardly accurate to say that spending on interest or defense have "fallen." They have increased enormously, but other spending has also increased enormously.
LynneShapiro2 — May 16, 2012
This is dangerous fuel for the "war on grandma, women, the poor" IMHO. But amounts aren't everything. How much of the Medicare and safety net spending goes to program administration and overcharges by providers and how much goes directly to help recipients? For example, I know from working at a visiting nurse agency that half the nurses' days were spent
filling out government forms and half visiting clients.
Sash — May 16, 2012
I'd like to know how defense spending was categorized. Wasn't the Interstate technically a defense project?
CHANGES IN FEDERAL SPENDING « Welcome to the Doctor's Office — May 16, 2012
[...] from SocImages [...]
gasstationwithoutpumps — May 17, 2012
Are those actual spending or just "budget" spending. A lot of defense spending is outside the budget.
Dianne — May 17, 2012
I find it interesting how few comments are here. It would seem that the "facts" dont line up with people's perceptions
Yrro Simyarin — May 17, 2012
This graph is a great example of how different measurements can make the budget look entirely different.
Should we look at spending as % of total budget, as % of GDP, as pure dollars, as inflation adjusted dollars, as per capita output, or as % of incoming revenues?
Does interest on the debt count toward to the legislation that most recently expanded it, or against all measures evenly?
Each paints a very different picture of where our budget issues lie.
Kinelfire — May 18, 2012
Does International Affairs include aid? The favoured portion of the budget for cutting of the centre-right across the 'developed' nations?
Barbara — May 22, 2012
So interest on our national debt (however it is measured is less important than that it was measured in the same way each time; this is true for all of the categories, if one is looking at change over time, which is the point of this story and of these figures) is about the same, as a proportion of our federal expenditures, as in the early 1960s? Amazing!! It is the same, proportionally (which is all that counts), as during one of our most prosperous economic eras. Therefore, it is NOT dragging the economy down, as crazy political rhetoric suggests. Almost all economists agree that economic growth, ESPECIALLY during a recession, depends on government spending, and all evidence supports this. And yet too many use the argument of a soaring national debt to lay off hundreds of thousands of public sector workers and to cut programs that help those already hurt by the recession. The real numbers make it clear that this argument is just an excuse to do what the right-wingers wanted all along:a stripped down government-except where the wealthy are involved-and a Darwinian society where "only the strong survive."