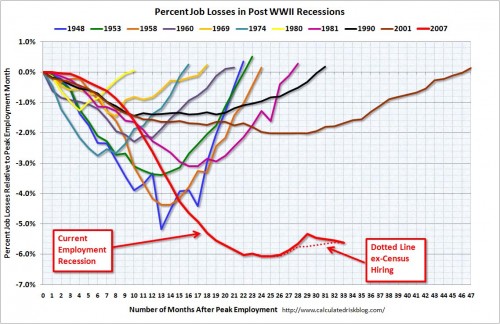
Kelsey C., a master’s student at the University of Colorado-Boulder, sent in this image from Calculated Risk showing the percent of jobs lost in each recession since 1948, relative to the peak of the pre-recession job market. In terms of the percent of jobs lost, the current recession is by far the worst we’ve seen since World War II:
The Bureau of Labor Statistics has a detailed report on employment (or the lack thereof) as of October 2010 available — including information on length of unemployment, numbers working part-time because they can’t find full-time work, labor force participation broken down by race/ethnicity, sex, and educational attainment, Veteran status, disability status, and more!


Comments 8
j-p — November 30, 2010
On the upside, outsourcing did marvels in Asia...
T — December 1, 2010
Uggh....
Jeremiah — December 1, 2010
It would be nice to see *what* jobs are being lost - are agrijobs more stable than construction? Banking? Programming?
But yeah, ugh....
abitha — December 1, 2010
It also looks like recessions are tending to last longer nowadays than they used to. The four most recent ones took the longest to return to baseline, even though some of them have been less severe in terms of percentage of jobs lost. Any ideas as to why this would be?
Kelsey — December 2, 2010
Markets also tend toward monopoly, which is why changes in the modes of production are more politically difficult over time. Witness energy.
Speaking of, sectoral job impacts can be found here:
http://www.bls.gov/news.release/empsit.t17.htm
Neoliberal Sustainability « The Generous Grasp — February 25, 2011
[...] necessary, etc. In terms of unemployment, the indicator most of us care most about, this is the longest and worst recession since World War II. So we all know the situation’s bad. Here in the US, state [...]