
[Note: A couple of readers have sent in info that calls into question the graphic below — not the relative sizes and such, but the specific numbers cited for the size of various spills (making them look larger than other reports). This may be a reflection of how the organization defines “spilled” oil (they say “lost to the environment”), and I provide their definition below. Thanks to T for providing a list of generally accepted estimates of major spills. Given that the organization providing the data is an association of oil tanker owners, it seems unlikely that they would be intentionally exaggerating the sizes of spills for political purposes or something. So while the graphic’s illustration of the relative size of these spills is still accurate in a general sense, unless I can track down a clear explanation for the cited numbers, I wouldn’t rely on them. Sorry for the confusion, and I’ll continue updating if I can figure out what’s going on.]
———-
Allie B. sent in a graphic comparing the BP leak to major tanker oil spills (and I forgot to add the numbers reported are in tonnes, which is about 2,240 pounds each):
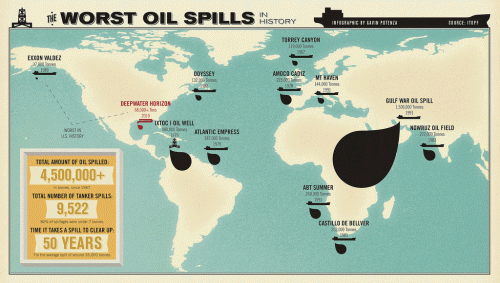
The info is based on data from The International Tanker Owners Pollution Federation Limited, an industry group that provides a lot of data on spills from oil tankers (so that doesn’t include leaks or spills from pipelines, wells, and so on). From the website:
It should be noted that the figures for the amount of oil spilt in an incident include all oil lost to the environment, including that which burnt or remained in a sunken vessel. There is considerable annual variation in both the incidence of oil spills and the amounts of oil lost. Consequently, the figures in the following tables, and any averages derived from them should be viewed with caution.
UPDATE: Commenter T points out that some of the numbers here (especially the Gulf War spill) don’t match up with more widely-reported data and seem to exaggerate the size of some of the spills. The relative sizes still hold up in general, but be cautious with the actual reported sizes of the spills. It may be that their way of defining spills (all oil “lost to the environment”) includes significantly more oil than what is traditionally counted as being part of a spill. I’m trying to track down exactly what’s going on here.
Given how much media coverage BP leak is getting, it’s a bit shocking to see it in comparison to the tanker spills represented here. That isn’t to say that somehow by comparison the BP leak isn’t that bad; rather, it made me aware of how little I usually hear about the environmental impacts of the global petroleum industry as long as they don’t happen along the U.S. coastline.
For instance, a recent NYT article discusses the impacts of oil leaks and spills in Nigeria:
The Niger Delta…has endured the equivalent of the Exxon Valdez spill every year for 50 years by some estimates. The oil pours out nearly every week, and some swamps are long since lifeless…leaving residents here astonished at the nonstop attention paid to the gusher half a world away in the Gulf of Mexico. It was only a few weeks ago, they say, that a burst pipe belonging to Royal Dutch Shell in the mangroves was finally shut after flowing for two months…
I think the illustration brings into perspective how our perceptions of environmental disasters are shaped (not surprisingly, I know) by the amount of media coverage it gets and whether it occurs in a place we’re familiar with. Some pollution gets national and international media attention (at least for a while), and some is largely ignored outside the local area directly affected. The BP leak is by no means the largest oil-related ecological disaster in history — not even close yet, and hopefully it won’t get there — but media coverage and clean-up efforts aren’t distributed equally. And, again, I’m not saying that somehow this means we shouldn’t be too concerned about the Gulf leak. But it does make clear that we’re not equally concerned about, say, all people whose livelihoods are devastated by petroleum leaks/spills in waterways.
And just out of curiosity about the link between U.S. oil consumption and Nigerian oil production, I went to the webpage of the U.S. Energy Information Administration to see how much oil the U.S. imports from Nigeria. It’s currently our 4th-largest source of crude imports, and our daily Nigerian imports are up quite a bit over a year ago (about 1.1 million barrels in April ’10 compared to 673,000 a day in April ’09):
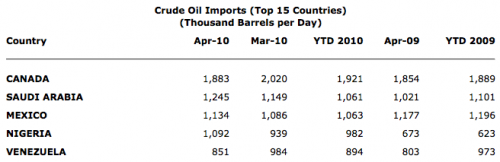
And I’m a bit embarrassed to admit that I had no idea Canada is currently our biggest source of imported crude oil (and total petroleum imports as well).
Gwen Sharp is an associate professor of sociology at Nevada State College. You can follow her on Twitter at @gwensharpnv.
Comments 31
T — July 9, 2010
It’s a really nifty infographic... but it’s not accurate. The Gulf War Oil Spill was significantly smaller, BY HALF. The high-end estimates are around 900,000 tons.
And it’s too bad it’s just the water-based spills and not land too.
T — July 9, 2010
Mike -- the infographic doesn't appear to be too precise. BUT all of the "media hype" about the current (active) spill in the Gulf o' Mexico shouldn't be discarded.
First, the language that's used is that it is the worst man-made environmental disaster in United States history. So, that limits it to this country.
Second, it's not the QUANTITY of oil that is spilled.... it is how it affects the environment. That Lakeview Gusher was the largest, but they could contain it with burms. Obviously, it had a huge impact on the environment, but limited. Also, the Gulf War Oil Spill was the largest at sea... but what was the impact on the environment? How sensitive are the ecosystems along the shore line? Do they have sensitive salt marshes like in Louisiana and Alabama? Do they have other fragile plants and animals like in Alaska with the Exxon Valdez spill?
Two pieces have to go together. There are active (natural) "seeps" along the California coastline that spew Exxon Valdez quantities every year... but the effect is qualitatively different.
Leontineg — July 9, 2010
There was a great piece on NPR about how the media ended up widely underreporting the size of the Valdez oil spill. Maybe it would help explain the descrepancies you guys found?
http://www.onthemedia.org/transcripts/2010/06/18/01
Lesley — July 9, 2010
Sorry to be slightly off context, but what an odd little map - its missed Australia and New Zealand and the rest of Asia - an as image, for me, if they can't get the geography right, I'm certainly going to be sceptical about the rest of the data. Representation-wise, its an interesting subtext - representing as far as I can tell oil sources that are of interest to the US (correct me if I'm wrong).
Tomato Sauce — July 9, 2010
Does anyone else find it surprising that all the biggest oil spills seem to cluster together in time?
78-79: Amoco Cadiz, Ixtoco I, Altantic Empress
83: Nowruz and Castillo
88-89: Valdez & Odessey
91: Gulf War, Mt Haven and Abt Summer
Which leaves only the first spill Torrey Canyon, which is not clumped with others...
Jon — July 9, 2010
This is yet another example of a poor infographic created by a seemingly skilled graphic designer. Unfortunately, many graphic designers have fantastic design skills, yet lack the analytic or statistical skills/knowledge/rigor to create an image that is easy to understand, aesthetically pleasing, and accurate.
In addition to the problems already mentioned, there are a few more glaring issues.
1. While ITOPF is indicated as the data source, the designer does not explain that the data are only from oil spills from “tankers, combined carriers, and barges”. The data for the Gulf War Oil Spill listed in the infographic is likely from another (not cited) source.
2. The ITOPF gathers data from “both published sources, such as the shipping press and other specialist publications, and also from vessel owners and their insurers”. This could account for some of the discrepancies with other official estimates, and is something that could be noted on the infographic.
3. The title is labeled “The Worst Oil Spills in History”. However, the data are derived from a table on the ITOPF’s website that only lists “major oil spills” since 1967. In addition, the designer has left off several major oil spills such as the Sea Star in 1972 (115,000 tonnes), Urquiola in 1976 (100,000 tonnes), Jakob Maersk in 1975 (88,000 tonnes) and others. I’m not sure why designer is so selective. So the infographic should instead be labeled something like “Some of the Largest Oil Spills from Tankers, Combined Carriers and Barges Since 1967”.
Also, some of the individual refernces on the cited Wikipedia page above simply refer back to the ITOPF's data.
allie — July 9, 2010
AH! I'm sorry I sent in a faulty graphic! I am glad that everyone still understands the point though and can see past it! :)
Mike — July 9, 2010
Record oil spills.(Disasters)(Statistical table).
World Almanac and Book of Facts (Annual 2007): p313(1). (230 words)
Show details
Full Text :COPYRIGHT 2007 World Almanac Education Group
The number of tons can be multiplied by 7 to estimate roughly the
number of barrels spilled; the exact number of barrels in a ton varies
with the type of oil. Each barrel contains 42 gallons.
Record oil spills
Name, place Date Cause Tons
Ixtoc I oil well,
S Gulf of Mexico June 3, 1979 Blowout 600,000
Nowruz oil field,
Persian Gulf Feb. 1983 Blowout 600,000 (est.)
Atlantic Empress and
Aegean Captain, off
Trinidad and Tobago July 19, 1979 Collision 300,000
Castillo de Bellver, off
Cape Town, South Africa Aug. 6, 1983 Fire 250,000
Amoco Cadiz, near
Portsall, France Mar. 16, 1978 Grounding 223,000
Torrey Canyon, off
Land's End, England Mar. 18, 1967 Grounding 119,000
Sea Star, Gulf of Oman Dec. 19, 1972 Collision 115,000
Urquiola, La Coruna,
Spain May 12, 1976 Grounding 100,000
Other Notable Oil Spills
Name, place Date Cause Gallons
Persian Gulf began Jan. Spillage 130,000,000 (1)
23, 1991 by Iraq
Braer, off Shetland
Islands Jan. 5, 1993 Grounding 26,000,000
Prestige, off N Spain Nov. 13-19, Ship broke 22,600,000
2002 in half
Aegean Sea, off N Spain Dec. 3, 1992 Unknown 21,500,000
Sea Empress, off SW Wales Feb. 15, 1996 Grounding 18,000,000
World Glory, off South
Africa June 13, 1968 Hull 13,524,000
Exxon Valdez, Prince failure
William Sound, AK Mar. 24, 1989 Grounding 10,080,000
(1) Est. by Saudi Arabia. Some estimates as low as 25 mil gal.
Source Citation
"Record oil spills." World Almanac and Book of Facts. Facts on File, Inc., 2007. 313. Student Edition. Web. 9 July 2010.
Document URL
http://find.galegroup.com/gtx/infomark.do?&contentSet=IAC-Documents&type=retrieve&tabID=T001&prodId=STOM&docId=A169140867&source=gale&srcprod=STOM&userGroupName=avlr&version=1.0
Gale Document Number:A169140867
GEM — July 10, 2010
I'd guess that most Americans don't realize that Canada is the U.S.'s biggest source of crude oil. How does that knowledge change your perception of Canada -- if it does?
Kate — July 11, 2010
I also think that people react less when it is 'wasteland' that is spilled on. Even though those pictures in the post were distrassing, it wasn't somehow as heartwrenching as seeing pristine tourist beaches covered in oil. I live in Australia, so it's not like it's closer to home, except in the (significant) sense of it being closer to my reality.
But when you're used to seeing images of africa and the middle east in poverty and economic and environmental ruin, it feel like less has been lost, because we put less value on what was there to begin with.
jvansteppes — July 14, 2010
If you're curious about Canada's complicated politics of oil (and bitumen), check out the book 'Tar Sands: Dirty oil and the future of a continent', by Andrew Nikiforuk.