This post originally appeared on Sociological Images in 2009.
Emily D. sent us a link to a post by Flowing Data linking to multiple efforts to visualize crime data. One of them featured an illustration (I split it into four parts for easy viewing). I’m sure the graphic elides details in the data, but I still think it’s interesting. I challenged some of my preconceived notions about who dies by gun, and you may find it surprising too.
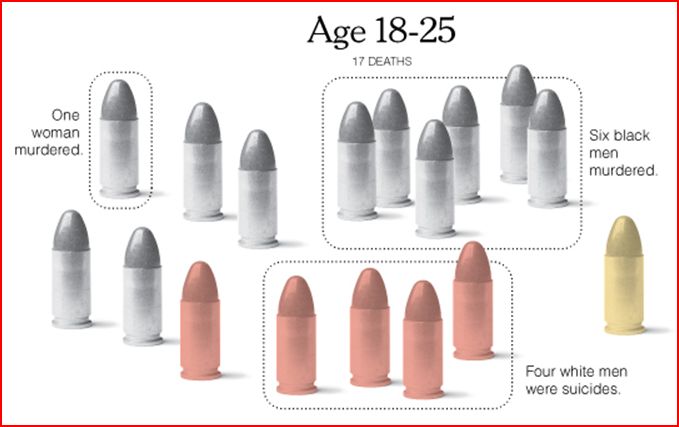
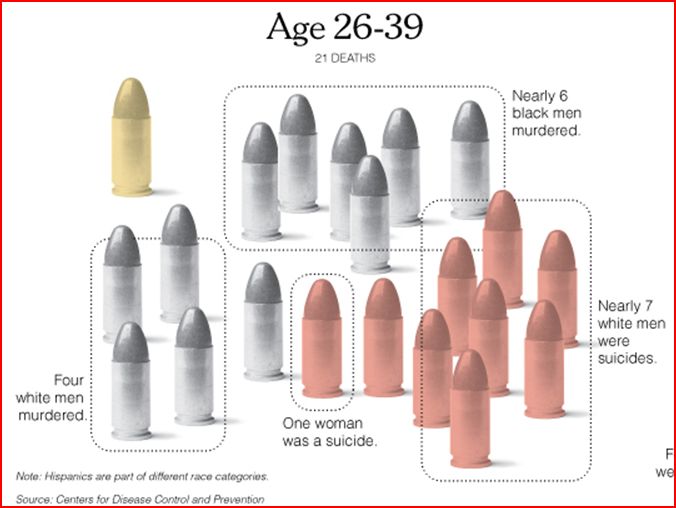
The data is from 2004. That year, an average of 81 people died from a gunshot wound each day. In the figures below, each bullet represents 81 deaths; grey bullets are homicides, pink suicides, and yellow accidents or being killed by a police officer.
(Methodological note: Differences in gun deaths by age group could be a matter of lifecycle or it could be a cohort effect. Since this data is a snapshot and not longitudinal, it’s hard to tell. Also, when you’re comparing age groups, it’s important to remember that people in these four age groups are not evenly distributed across the population.)

Five percent of the people who died due to guns was age 17 or younger (I say “only” advisedly). People under 18 make up about 24% of the population. Black men and white men are murdered at about the same rate (one a day, or one every 30 hours, respectively) which means that blacks are disproportionately victims of murder because they make up 12-13 percent of the population as opposed to the 80 percent of the population that is white. Men are four times as likely as women to be killed. There were about half as many suicides as there were murders, and half as many accidents/police killings as well.

About 21 percent of all gun deaths were among people ages 18 to 25. About 90 percent of all murder victims are men, and about half of those are black men. Accidents/police action are occurring at about the same rate, but suicides have skyrocketed. There are five times more suicides among people 18 to 25 than there were among those 17 and under. Four-fifths of the people who choose to take their own life are white men (who make up less than 40% of the population).

People 26 to 39 years old accounted for 26 percent of gun deaths. The murder rate has a similar racial distribution. Like before, the rate of accidents/police killings have stayed the same. But suicide rates have continued to climb. There are nearly twice as many suicides among this age group as there were in the previous one. The majority of these are white men. One in nine was a woman.

Among those 40 and over (48 percent of all gun deaths occur to someone over 40), there is a stark increase in the number of suicides. There were 2,430 suicides, compared to 1,215 suicides among all other age groups combined. Eighty-three percent of these suicides are committed by white men. Murder has finally decreased and the racial and gender distribution is less uneven than before. There are twice as many accidents/police killings among this cohort.
Media portrayals of gun violence tends to highlight women who are murdered (especially if you watch crime and law TV shows), black on white violent crime (if you watch the news), youth violence (take your pick), and murder over suicide. This graphic challenges all of those notions.
This site lets you parse out data for homicides in Philadelphia by gender, age, time of day, and weapon, and this site lets you parse out similar data for homicide in Los Angeles county.
Lisa Wade, PhD is an Associate Professor at Tulane University. She is the author of American Hookup, a book about college sexual culture; a textbook about gender; and a forthcoming introductory text: Terrible Magnificent Sociology. You can follow her on Twitter and Instagram.
Comments 26
Nataly — July 3, 2009
I find it really interesting that the men are divided into races, but women are just women. Really goes to show how "male" is considered the default and "female" is a group onto itself.
Anonymous — July 3, 2009
No, it doesn't. Other things might, but this doesn't at all.
So few women are present in these statistics that it's visually difficult and not terribly worthwhile to divide them into races. In two out of three images, women are represented by a single bullet...
alana — July 3, 2009
This is really interesting, but is the number of deaths for 17 and under really only 4 a day in 2004? I’m only asking because I know 3,006 children died from firearms in 2005 which was a 181 death increase. Shouldn’t that have put the number around 7?
Anonymous — July 3, 2009
It should be noted that the suicide numbers might be a little misleading. Men and women typically have different preferred methods for attempting suicide and men are more likely to use a gun. These differences may be present in the different age and race cohorts as well.
Bagelsan — July 3, 2009
Thought it was interesting that "police shootings" was grouped with "accidents" ... talk about some unconscious bias! I'm sure there are plenty of people out there who would be more comfortable grouping shootings by police under "murder" for example.
Joshua — July 4, 2009
@Bagelsan: I was about to make the same comment. What the fuck?! No matter how you slice it, a police officer intentionally shooting someone is not the same as an accident. I would love to hear the researchers' reason for grouping these two together.
Also, I wonder how many of the "murders" were in fact self-defense shootings. I note that category is totally absent from these statistics. I, for one, distinguish between a person who is shot by a criminal (what I would call murder) and a person who is committing a crime that results in them being legally shot (not murder, but justifiable homicide). It's typical for people who have a conscious or unconscious anti-gun bias to fail to discriminate between these to very different cases.
Kate — July 5, 2009
I absolutely agree with the last two comments. I don't care how 'accidental' a death from a police gun is, it is NOT the same as an accident in the home. I actually find it a bit disturbing that they are grouped like that.
Norm — December 18, 2012
Accidents and police shooting aren't combined for any sort of thematic reasons, as I see it. It's simply the "other" category that combines things that are so rare they are not significant on their own. I'm not sure I understand why people see this as nefarious on some level.
Justin Sauer — December 18, 2012
Repost! Booooooooooooring! *snooze*
Gman E Willikers — December 18, 2012
Contrary to the above I see very little black on white violent crime reported in the news. Most of what I see is black on black. If it involves whites it is seems to usually be a white on white crime.
Fernando — December 18, 2012
I'd say murder gets more attention than suicide because the usual thing is for the media not to report on suicides on the idea that this would encourage more suicides.
Suicides are reported when it is a notable individual or when the event forced news reporting, such as a suicide causing a traffic jam. Perhaps another situation would be a report on suicide in general, but this would be punctual.This might not be the case in every news company but it is a widespread principle.
JACK MCGEE — December 19, 2012
LIVE BY THE GUN DIE BY THE GUN
Whose Lives End by Gun? » Sociological Images « National-Express2011 — December 19, 2012
[...] on thesocietypages.org Sharen mit:TwitterFacebookGoogle +1TumblrPinterestEmailMoreLinkedInLike this:LikeBe the first to [...]
Joel Torgeson — December 20, 2012
Great analysis! It's interesting to see how all of these numbers break down across the different ages, races, and genders. I agree that some of the death groupings are interesting (murder might include self defense, police shootings grouped with accidents, etc.) but I think that it makes sense for the points that the graphs seem to be trying to make.
Chi di spada ferisce di spada (non) perisce « momatwork — February 13, 2013
[...] uccisi per atti di violenza non domestica sia più alto e la condizione maschile relativamente meno vantaggiosa. Ed è interessante anche vedere come un aspetto che a noi viene generalmente presentato in maniera [...]