The Paris School of Economics has posted a database, compiled by Facundo Alvaredo, Tony Atkinson, Thomas Piketty, and Emmanuel Saez, of the distribution of top incomes in a number of nations, with more on the way. Using income tax records, they provide a quick glance at concentration of income among the wealthy over decades (and in some cases, data extends back over a century). As the authors point out, there are limitations to using tax info to measure inequality, so it’s important to be aware of the limitations of this data series. Most obviously, individuals may take steps to hide their income to evade taxes, and the very wealthy may be particularly able to do so through the use of tax havens, etc. Also, tax policies change, so what counts as “income” at one point might not at another. The authors also had to contend with differences in the taxation unit (households vs. individuals) in different countries to provide some level of comparability.
The database allows you to select a country, a time period, and a variable (top 5% income share, etc.), and get a table showing the results for all years in which data were available. Here, for instance, is part of the table for the share of income earned by the top 1% in Singapore:
Of course, this includes only data on income. In many countries, including the U.S., wealth (value of all assets) is significantly more concentrated than income.
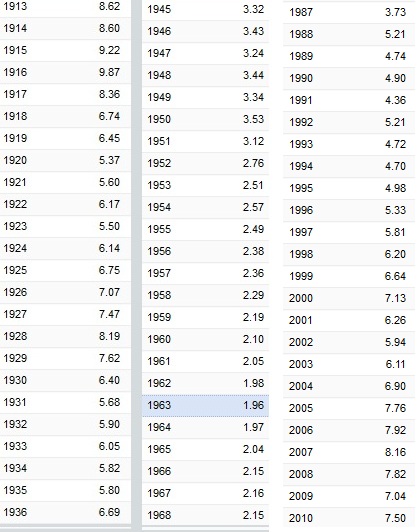
Looking at the dataset, you can see patterns over time. For instance, here’s part of the data from the U.S. (notice there are time gaps between the end of each column and the beginning of the next–I was just grabbing some illustrative screencaps), showing how the percent of income earned by the top 0.1% decreased significantly starting in the 1940s, but began creeping up again by the late 1980s and has grown since then:
The site also allows you to create graphs. They provide a comparison of the share of income earned by the top 1% in 2005 in the U.S., Japan, Australia, and France, but you can look at data for individual nations:
It’s worth playing around a bit, but keeping in mind the caveats about what these data do and don’t tell us. Thanks to Shamus Khan for the tip!


Comments