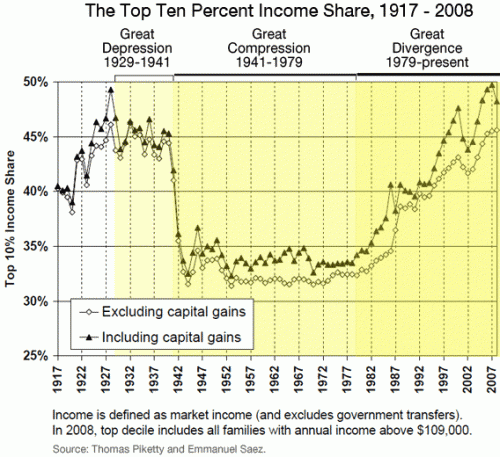
I’m back! I was in the middle of moving and just overwhelmed with everything. Anyway. Talking Points Memo posted a link to an article at Slate about income inequality in the U.S., and particularly the increasing proportion of total U.S. income earned by the very rich. Timothy Noah refers to the “great compression” as a time period when income concentration among top earners dropped significantly, and argues that in the past three decades we’ve seen a “great divergence,” with increasing income inequality hitting levels not seen since the Great Depression:
A slideshow accompanies the article, providing more info on the changes Noah discusses. A few examples (the slideshow provides the data source used to create each image):
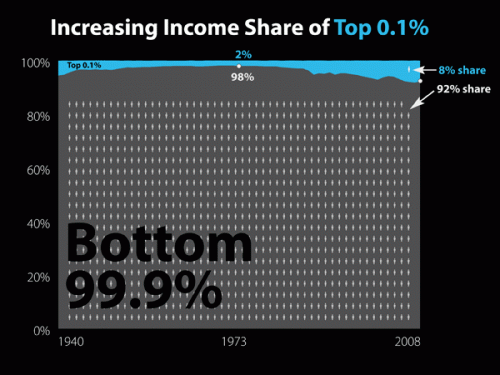
Even among the very rich, we see increasing divergence, with the super-ultra rich, the top 0.1% of earners, now making 8% of all U.S. income:
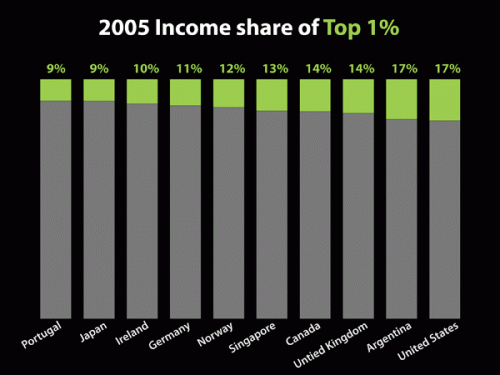
A comparison to some other countries (I don’t know why these specific nations were chosen for the comparison):
Keep in mind, this data includes only income. Wealth — the worth of all assets, including retirement and savings accounts, stocks, homes, cars, and anything else of value — is much more unequally distributed.
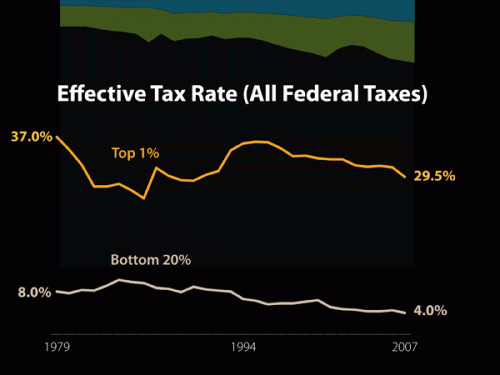
Congress is about to be embroiled in a major debate about whether to extend the tax cuts on high incomes; as both sides weigh in, here’s some context to keep in mind:
The effective tax rate is what people actually pay, as opposed to what their tax rate theoretically is. While we’ve certainly seen a large drop since the late ’70s, Noah argues that, compared to other economic changes, the effective tax rate hasn’t affected the rise in income inequality much. It plays a role, yes, but changing the tax rate on the very rich doesn’t affect the overall distribution of income a huge amount, in part because the effective rate, what people end up actually paying, generally ends up being smaller than what they theoretically owe based on the stated tax rate, once you take into account deductions, write-offs, loopholes, and so on.
So…happy post-Labor Day!


Comments 25
Labor Day Reader « O, Pioneers! — September 7, 2010
[...] UPDATE: If you’re interested in America’s vast income gap – as I am – Sociological Images has another post on it today (9/7/10) called “The Great Income Divergence.” [...]
Bob — September 7, 2010
Have you seen any research which addresses what proportion of this divergence can be attributed to more women entering college and the rise of dual income households? When people with access to higher education typically meet their spouse there, it seems easy to expect a compounding of their opportunities.
Last year, NPR's All Things Considered reviewed a book called "Weddings of the Times: A Parody" which spoofs NYT wedding announcements. In this show, a phrase was uttered which has significantly colored my thinking on the rise of income inequality in the past couple decades (and answers why it didn't begin earlier). The phrase was "academic and professional inbreeding."
http://www.npr.org/templates/transcript/transcript.php?storyId=104829612
T — September 7, 2010
Wow. I'm glad I'm in the top part of those charts! It must suck to be in the bottom.... :-)
Calvin — September 7, 2010
Given the international comparisons, it's surprising (and somewhat comforting) to know that these type of income disparities are may be a natural consequence, not pathology, of industrialized capitalist economies.
I'm also amused to find out that the richest people really are taxed that much. It's kind of interesting to learn, especially when you always hear about the rhetoric about the rich getting tax breaks at the total expense of the poor.
Ed — September 7, 2010
Even though the income tax might not have that big effect on the income divide, I suspect the estate tax (which I believe takes into account the wealth divergence the post mentions) might have a bigger effect. Of course, the Estate tax has only been dropping since 2001, while the first graph indicates that incomes were diverging since 1980 or so. Perhaps the deregulation and corporate friendly policies had the effect of starting the divergence, and it built on itself.
Now even though some wealth was lost in 2008, the rich are still weathering the recession better than the poor. The unemployment rate for people with bachelor's degrees is 4.5% and for people with graduate degree is around 4%. Meanwhile, the people without high school degrees have an unemployment rate of 14%, and people with a high school degree have an unemployment rate of 10%.
It may be that a 5% or so income tax rate on people with incomes over 250 grand would only yield an effective increase of two and half percent. I'll take it.
Let's do something more aggressive with the inheritance tax as well. You can't take it with you. Your kids can be legacies at Hahvahd or Yale, or you can give a building. You can still leave them a whole lot, just not everything. The poor could use a bump in the EIC, and if that means the kids of the poor get better educations and become more productive citizens (who pay higher taxes), I'll take that too.
It does suck to be in the bottom.
Jeremiah — September 8, 2010
It would be nice to see a breakout of tax burden as percentage of total income or worth. You could double the tax burden on the top 2% of earners and they'd still never feel it.
I wish SO had delved into the sociology of why so many people will vote for policies (tax cuts on top earners) that harm them, and how that connects with our fetishising of wealth.
PO — September 8, 2010
Wow. A 50% reduction in the effective tax on the bottom 20% is amazingly progressive! You don't hear about that very often.
Also, why did the choose 1979 to start the graph I wonder?
Bob — September 8, 2010
I really wish you would reproduce that data AL (comment 374841), because everything I've come across in the past couple hours looking for an answer to my question in the first comment still shows rising income in the bottom quintile since at least the 50's. I still haven't found how fast the relative quintiles are rising though. (They could be rising at the rate, and thanks to the miracle of compounding interest, still be diverging.)
I did however come across this link which partially answers my query in the first comment:
http://wapedia.mobi/en/Income_inequality_in_the_United_States#6.
"Income inequality has many causes, some of which are relatively clear, others which remain unknown and yet others which remain disputed.
At a structural level, a basic cause of household income inequality is differences in "hours worked per household (per year)", which may be decomposed as
number of workers × weeks worked per year × hours worked per week.
As the chart at right demonstrates, this is a significant factor in lower income households, all of these factors rising significantly from the 1st to the 4th quintiles, but a relatively minor factor in upper-income households (4th and 5th quintile), varying only slightly compared to the variations in income.
Beyond total hours worked, income inequality is due to different rates of income per hour, and unearned income, and the causes of these differences are more complicated and contentious, as described below, though are largely correlated to education level..."
As Seen On Great — September 9, 2010
[...] The Great Income Divergence » Sociological Images Timothy Noah refers to the “great compression” as a time period when income concentration among top earners dropped significantly, and argues that in the past three decades we've seen a “great divergence,” with increasing income . [...]
The Disastrous Legacy Of Ronald Reagan In Charts | NEWS JUNKIE POST — February 6, 2011
[...] charts for the share of wealth controlled by the top 10% and top 0.01%. Ronald Reagan and the conservatives ushered in an era of unbridled greed. An [...]
Read It And Weep – Reagan’s Real Record | Thurman's Notebook — February 6, 2011
[...] charts for the share of wealth controlled by the top 10% and top 0.01%. Ronald Reagan and the conservatives ushered in an era of unbridled greed. An [...]
The Myth of Saint Ronnie and Our Current Dilemma | Comments from Left Field — February 14, 2011
[...] charts for the share of wealth controlled by the top 10% and top 0.01%. Ronald Reagan and the conservatives ushered in an era of unbridled greed. An [...]