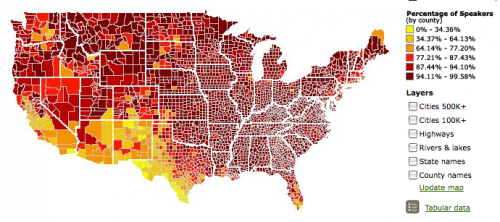
The Modern Language Association has all kinds of awesome language-related data available that you can customize depending on your interests. Most basically, you can get an interactive map showing the percent or number of speakers of various languages spoken at home by county (or number by zip code). Here is English:
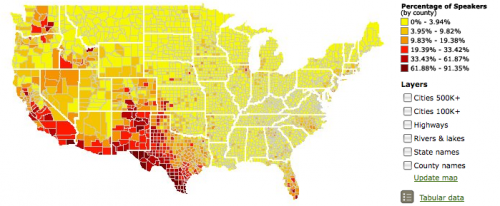
Spanish:
Navajo:

Notice that the scale of the maps changes, so the same color doesn’t indicate the same percent of speakers for each language. For some languages the darkest red only indicates 1 or 2 percent.
There was one odd category I noticed. This is the map for “African languages”:
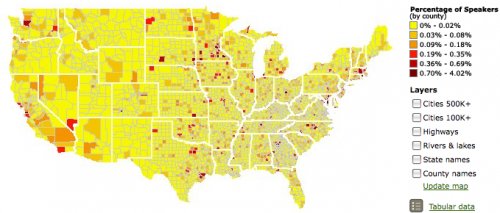
I can understand why you might lump some languages from an area together if they are so rare in the U.S. that they’d barely show up. But what, exactly, is an “African” language? It doesn’t appear to include Arabic, though it is spoken in much of northern Africa. Many people in Africa speak European languages (particularly French and English) due to colonialism. Presumably this category includes “native,” non-Arabic languages. It’s a strange category.
For those of you wondering about the little pockets of African language speakers in, say, Iowa and Nebraska, I could be wrong, but I would suspect in some of those counties it might have something to do with slaughterhouses. In the last decade or so some packing houses have recruited African immigrants, particularly Somalis, to move to rural areas and work in the plants. Again, that’s just a guess, but some of the locations fit.
UPDATE: Commenter mordant.espier says,
I think you’re wrong about African languages and meatpacking in the midwest. I know that Omaha has a significant Sudanese community, about 7,000, many of whom are refugees and asylum seekers. In Minneapolis, there are a number of Somali. They are there because of the US government, and even more because religious and charitable organizations, especially the Episcopal Church and Catholic Charities, have provided support through all stages of the immigration process. The existance of a group of refugees who are able to enlist the support of locals has created such pockets.
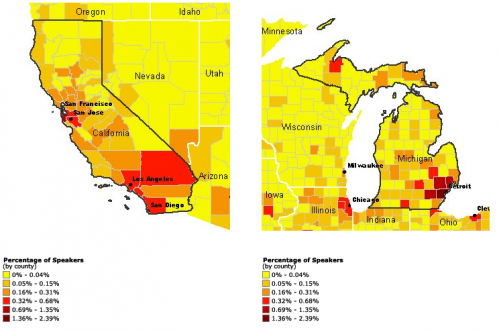
Anyway, moving on.You can also get side-by-side comparisons of two states. This shows the percentage of the population speaking Arabic in California and Michigan:
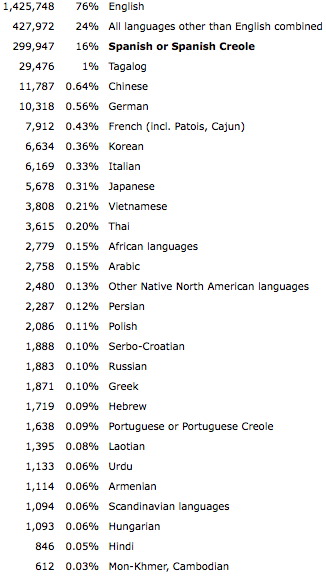
Number and percent of speakers of various languages:
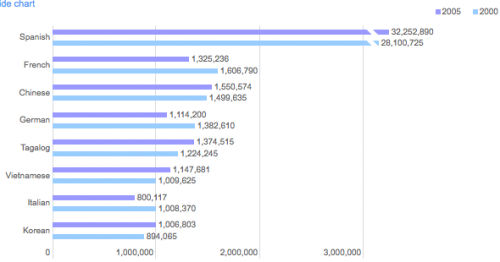
You can compare the number of speakers in 2000 and 2005:
If you go to “Language by State” in that last link and select a language, you can then look at “ability to speak English”. Annoyingly, it only shows raw numbers, not percentages, so you have to do the calculations yourself. But here’s the breakdown for German in Michigan; clearly the vast majority of people who speak German also say they speak English “very well”:

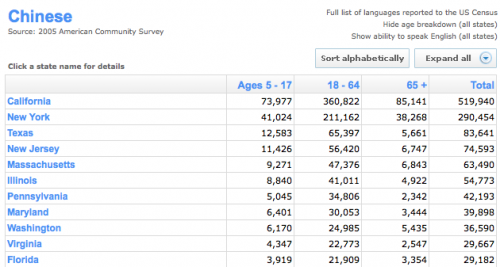
You can also get an age breakdown (again, just raw numbers) for each language, by state. Here’s a partial list for Chinese:
I’m warning you now, the site can turn into an enormous time-suck. You think you’ll just look up the state you live in, say, and then you get started comparing things, and the next thing you know, it’s a half hour later.
UPDATE 2: Commenters have also pointed out that a) “Chinese” is as much of a thrown-together category as “African” (does it mean Cantonese? Mandarin?) and b) the site doesn’t have any information about use of American Sign Language, both great points.

Comments 40
renee — January 12, 2010
I don't think grouping together the indigenous languages of sub-Saharan Africa is all that weird. Here in Portland, Maine, there's a huge range of African languages spoken in the elementary schools (I can't get to the article that lists them all, unfortunately, but I guarantee most Americans haven't heard of more than half of them), but I'm sure each one is spoken by a dozen kids at most, which would not be easy to show on a map.
But I agree, this is a great site; this kind of thing gets me very excited for the 2010 census.
Jeff Kaufman — January 12, 2010
African languages, as they define, are:
Acholi, Amharic, Ashanti, Bantu, Bari, Bembe, Berber, Chadic, Cushite, Fanti, Fulani, Fur, Ga, Hausa, Ibo, Kikuyu, Kinyarwanda, Luganda, Mande, Mandingo, Ndebele, Somali, Sudanic, Swahili, Temne, Tonga, Twi, Wolof, Xhosa, Yoruba, and Zulu.
If you look at the FAQ, http://www.mla.org/map_about#10 , you can see they also make other groupings:
"Other Asian languages" includes Azerbaijani, Brahui, Burmese, Burushaski, Chuvash, Coorgi, Dravidian, Gondi, Kachin, Kannada, Karachay, Karakalpak, Karen, Kazakh, Kirghiz, Kurukh, Malayalam, Miao-yao, Mien, Mongolian, Munda, Muong, Tamil, Tatar, Telugu, Tibetan, Tulu, Tungus, Turkish, Turkmen, Uighur, Uzbek, and Yakut.
"Other Indic languages" includes Asian Indian, Assamese, Bengali, Bhili, Bihari, Kashmiri, Konkani, Maldivian, Marathi, Nepali, Oriya, Panjabi, Punjabi, Rajasthani, Romany, Sanskrit, Sindhi, and Sinhalese.
"Other Indo-European languages" includes Afghani, Albanian, Balochi, Breton, Catalonian, the English Creoles Belize and Guyanese, Gullah, Hawaiian Pidgin, Irish Gaelic, Jamaican Creole, Krio, Kurdish, Latvian, Lettish, Lithuanian, Ossete, Pashto, Pidgin, Rhaeto-Romanic, Romanian, Romansch, Rumanian, Saramacca, Scottic Gaelic, Tadzhik, and Welsh.
"Other Native North American languages" includes Apache, Cherokee, Choctaw, Dakota, Pima, Yupik, and 160 other languages.
"Other Slavic languages" includes Bulgarian, Czech, Kashubian, Macedonian, Slovak, Slovene, and Ukrainian.
"Other West Germanic languages" includes Afrikaans, Dutch, Flemish, Frisian, and Pennsylvania Dutch.
"Scandinavian languages" includes Danish, Faroese, Icelandic, Norwegian, and Swedish.
mordant.espier — January 12, 2010
I think you're wrong about African languages and meatpacking in the midwest. I know that Omaha has a significant Sudanese community, about 7,000, many of whom are refugees and asylum seekers. In Minneapolis, there are a number of Somali. They are there because of the US government, and even more because religious and charitable organizations, especially the Episcopal Church and Catholic Charities, have provided support through all stages of the immigration process. The existance of a group of refugees who are able to enlist the support of locals has created such pockets.
mordant.espier — January 12, 2010
...Though I suppose the ability of small rural communities to support immigrants might be adied if there is paying work that doesn't require English, and thus communities with meat packing might be able to bring in more immigrants. I guess in those cases you'd be able to get missionary satisfaction as well as cheap labor.
jen — January 12, 2010
Fargo also has a large Sudanese and Somali community. Fargo has a branch of Lutheran Social Services that placed a high priority on refugee placement in the 90s. Minneapolis also has a sizable Liberian community. Minneapolis also has large Eritrean, Ethiopian and Kenyan communities.
Janey — January 12, 2010
Interesting to see that American Sign Language was not addressed. Most metropolitian areas have large Deaf communities.
Duckrabbit — January 12, 2010
Like Janey, I couldn't believe ASL was not included. To people who don't have academic interests in geographic distribution of languages, these data here are mostly interesting as a curiosity. But data on the geographic distribution of ASL signers would have been very useful to families considering a move to support a deaf child.
jfruh — January 12, 2010
I'm assuming the numbers given, especially for English, are actually for first or primary languages, yes? I find it kind of hard to believe that there's anywhere in the US where a majority of people literally do not speak English. Perhaps this is so in some places along the Mexican border, but the English map shows that, for instance, Maine's northernmost county has a relatively low English-speaking population. This is no doubt because of the French-speaking community there, but my understanding is that very few people in that region are monolingual in French.
Sarah — January 12, 2010
I'm curious about the history of African and/or Somali and Sudanese immigrants being actively recruited to work in slaughterhouses in the Midwest. I don't know anything about slaughterhouse work, nor African immigrants, but is there a particular reason why the Midwest is a focal point, or why slaughterhouses in particular are reaching out to this community?
John Yum — January 12, 2010
You ask what they consider "African". But you completely glaze over the question of what is "Chinese"? Do they mean Mandarin only? What about Shanghainese? Cantonese? True, Shanghainese and Cantonese are from the same family of languages as Mandarin, but what about the five other language groups spoken in the country?
Why don't you ask about "What is meant by 'Chinese'?" the same way you ask about Africa? Because there aren't as many different possible languages? Because of the obvious impacts of European colonialism in shaping our own perceptions of "Africa" (as if it didn't exist with China)?
Elena — January 12, 2010
Apparently there are speakers of Catalonian (and/or Valencian?) but no speakers of Basque? :/ Strange. I thought there was a significant number of Basque emigrés in the USA.
Umlud — January 12, 2010
What are you trying to imply here? Is it merely that people should make sure to check the scale in the legend... or that the map is doing something fishy?
If the former, then yes. Good advice. Everyone should always be careful to check the parameters they are looking at, whether it is the scale of a graph or a map.
If the latter, then you apparently need to learn about GIS software. What the automatically generated map GIS program is set up to do is spread out the different categories of data along a scale that makes sense for the range of the dataset used. It's no different than when Excel (or any half-way decent graphing program) automatically re-scales the axes when data with different ranges are examined.
Jillian C. York — January 12, 2010
The "African languages" thing is weird, made only weirder by the fact that they list "Berber," a non-language, in their list of languages. "Berber" is actually just the Western demonym for a group of languages including Tamazight, Tarifit, and Tashelheit (in Morocco; I know less about the "Berber" languages of the rest of North Africa, but there are several!)
I'm left to wonder if the same problem exists for any other languages I know less about.
IchBinNishK'Gelt — January 12, 2010
interesting that there is Hebrew, but not Yiddish. Hebrew is spoken by Israelis only where Yiddish is a diasporic language spoken by Ashkenazik Jews (Jews from Europe east of Germany) in the US and across Europe and South America. No surprise they didn't include the other Jewish diasporic language, though (Ladino, spoken by Sefardic Jews from Spain, Arabia and North Africa, it's almost a dead language...)
The Languages of America | Free Market Mojo — January 17, 2010
[...] Sociological Images (via Chart Porn) presents the different languages of America. [...]
Anonymous — March 16, 2010
والله ماعندكم ماعند جدي؟
Damon — April 2, 2010
Not that anyone is likely to ever read a comment on an article this old but FTR "Chinese" is not anywhere near as "thrown-together" a group as African languages. There's somewhere around 1500 languages native to Africa, in several groups unknown to be related at all. Whereas Chinese is a group of, what, up to a dozen (depending how you divide them) very closely related languages, that are traditionally regarded by the Chinese themselves as dialects of a single language. (The difference between dialects and languages is, of course, more of a sociocultural question than a linguistic one.)
So it's a horribly unapt comparison. I mean, try to get basic facts right.
Anonymous — January 30, 2011
have you give me some example about opened questionnaire about vernacular?