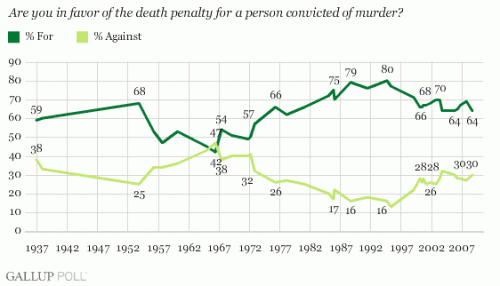
I found this graph of public support for the death penalty over time at the Gallup Poll website:

I’m not sure what the “2828” and “3030” are at the right-hand side of the “% Against” line–perhaps they didn’t round off the %s? I looked at the specific %s given in a table and that seems to fit–that they were supposed to be 28% and 30% and somehow weren’t entered correctly.
Some other questions that were asked:
Generally speaking, do you believe the death penalty is applied fairly or unfairly in this country today?
|
Fairly |
Unfairly |
No opinion |
|
|
% |
% |
% |
|
| 2008 Oct 3-5 |
54 |
38 |
8 |
| 2007 Oct 4-7 |
57 |
38 |
5 |
| 2006 May 8-11 |
60 |
35 |
4 |
|
2005 May 2-5 |
61 |
35 |
4 |
| 2004 May 2-4 |
55 |
39 |
6 |
| 2003 May 5-7 |
60 |
37 |
3 |
| 2002 May 6-9 |
53 |
40 |
7 |
| 2000 Jun 23-25 |
51 |
41 |
8 |
Asked about if the person believes an innocent person has been executed in the past 5 years:
|
|
Yes, in past |
No, not |
No |
| 2006 May 8-11 |
63% |
27 |
10 |
|
2005 May 2-5 |
59% |
33 |
8 |
| 2003 May 5-7 |
73% |
22 |
5 |
Do you feel that the death penalty acts as a deterrent to the commitment of murder, that it lowers the murder rate, or not?
|
|
Yes, does |
No, does not |
No opinion |
|
% |
% |
% |
|
|
2006 May 8-11 |
34 |
64 |
2 |
| 2004 May 2-4 |
35 |
62 |
3 |
| 1991 Jun 13-16 |
51 |
41 |
8 |
| 1986 Jan 10-13 |
61 |
32 |
7 |
| 1985 Jan 11-14 |
62 |
31 |
7 |
The answer to that last question is interesting in that it indicates people do not, in general, support the death penalty because they believe it reduces the likelihood of more murders. The most common response to why people support it is based on a retaliation/”eye for an eye” principle, not deterrance:
|
|
May |
Feb |
Feb |
Jun. |
|
% |
% |
% |
% |
|
| An eye for an eye/They took a life/Fits the crime |
37 |
48 |
40 |
40 |

Comments 12
Sabriel — September 21, 2009
It would be interesting to match that up with a list of highly publicized or contested death penalty cases.
Clayton — September 21, 2009
I think "2828 and "3030" are 2 separate numbers, two-digit ones like the others. Look at "64 64", there is just more space.
John Stark — September 21, 2009
"The most common response to why people support it is based on a retaliation/”eye for an eye” principle, not deterrance"
And yet Jesus said: You have heard that it was said, "An eye for an eye and a tooth for a tooth". But I say to you, do not resist an evildoer. If anyone strikes you on the right cheek, turn to him the other also.
md — September 21, 2009
What's amazing is that a vast majority of people (over 70% in 2003) believe that an innocent person was executed in the past 5 years but still a majority are in favour of the death penelty!
Idril — September 21, 2009
I wonder what happened during the 1950s and 1960s for approval rates to decline so dramatically, and for the percentage of "against" to even get a short-lived majority. Does any of you have an idea ? The Rosenberg couple maybe ?
george — September 22, 2009
I think the easiest way to understand the rate of support for the death penalty is to plot it against either the rate of violent crime or the murder rate (the trends in those rates are essentially the same, so it hardly matters which you choose.) I found the data here : http://bjsdata.ojp.usdoj.gov/dataonline/Search/Crime/State/statebystaterun.cfm?stateid=52
Plot that against the "support" percentage from the gallup poll. It's amazing how well the crime rate and death penalty support rate coincide. In response to the above comment - I'd say in the 1950s the crime rate was so low people thought they ought to get rid of the death penalty. When the crime rate went back up, they changed their minds.
For fun you can also plot the number of executions in the U.S. vs. the crime or murder rate (http://www.ojp.gov/bjs/glance/tables/exetab.htm). There's some decent evidence there that the death penalty is indeed a deterrent. Really though, you'd need to do a more indepth study to rule out that it's mere correlation. It looks to me like the execution curve is shifted to the left compared to the crime rate curve - implying causation.
Other — September 22, 2009
On a related note, I think you might be interested in this poll of Australians on their stances on the Death Penalty versus Life Imprisonment conducted by Roy Morgan Research.
http://www.roymorgan.com/news/polls/2009/4411/
The results are quite different compared to the American poll.
SarahMC — September 22, 2009
I found this surprising, in light of what I thought was more awareness of problems with the death penalty's unfair/racist application. I guess some people just don't care.
Natalie — September 22, 2009
I'm not so good on my US history - could someone please tell me what happened 65-67?