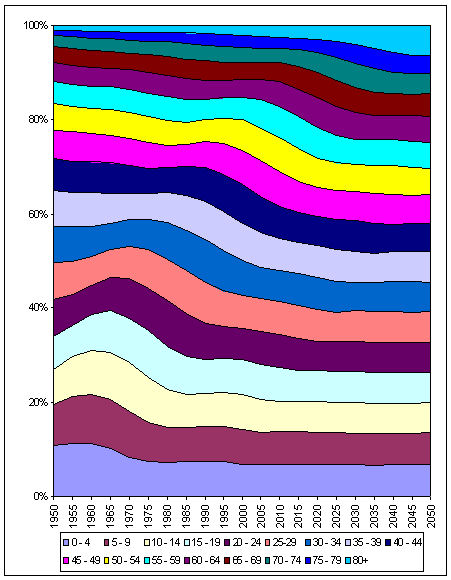
Mark Thoma at Economist’s View posted the following graphical representation of changes in the age distribution of the population of the U.S. between 1950 and today, and projected to 2050:

The bump, slowly moving off to the right, is the baby boom generation. The downward slope in the lines as you move to the right represents a population with a larger percentage of older people or, in other words, an older average age. If the forecast is correct, about 10 percent of the U.S. population will be over 75 by 2050.
Mark observes that many examinations of historical trends likely need to take into account this changing age distribution. For example, he asks:
…with a larger and larger fraction of the population moving into the asset liquidation phase of their life-cycle, how is the saving rate affected? How much of the change in the saving rate in recent years is attributable solely to changes in the age-distribution of the population?
—————————
Lisa Wade is a professor of sociology at Occidental College. You can follow her on Twitter and Facebook.

Comments 6
Duran — July 14, 2009
Finally, a post from lisa that doesn't have political undertones.
Anyway, I'm frankly terrified as to what's going to happen as our population ages. In an economic sense, having to support all that baggage is crippling.
You think it's going to be bad for the USA? Try the developing world, most of whom have population age graphs that make the baby boomers look like a statistical anomaly.
Jesse — July 14, 2009
I'm 26. I don't see retirement, at any age, as a viable option in the future. I'm trying to create a financial situation and a skill set that should hopefully support me (along with effort on my part) as I age. I think the most important skill is learning to learn. Hurray advanced degrees!
Also, I couldn't stop paying attention to how promising but ugly that graph is. So I made my own version: http://orbitalteapot.blogspot.com/2009/07/do-you-enjoy-looking-at-graphs.html
Ellen — July 14, 2009
I think that many of our fears about this has to do with stereotypes about aging. A great example is how Duran assumed aging people are "baggage."
Hank — July 15, 2009
I don't think our fears about this really have so much to do with stereotypes about aging as it does the fact that a declining (and aging) population has real effects on on a nation's economy. Aging or retired people are, in some sense at least, baggage because once they are retired they are presumably no longer producing, but are still consuming on the state's dime (assuming they take advantage of Social Security and/or Medicare). I'm not sure exactly of the effect a 401(k) or other retirement plan has compared to a state-sponsored one, though, and I wouldn't mind more state interference.
Ali — July 15, 2009
once they are retired they are presumably no longer producing, but are still consuming on the state’s dime (assuming they take advantage of Social Security and/or Medicare).
You're forgetting that most if not all people coming up on retirement have paid into social security their entire adult life. I wouldn't consider that "consuming on the state's dime".
Anonymous — July 15, 2009
While the data are interesting, this graph is horrendous. It contains too many categories, too many distracting colors (looks like the default colors in Excel 2003), and and has a large amount of data-ink.
I'm new to this site but continually amazed by the inclusion of poorly constructed graphs.
See Edward Tufte and, to a lesser extent, Stephen Few for excellent insight on these matters.
Edward Tufte
http://www.edwardtufte.com/tufte/index
Stephen Few
http://www.perceptualedge.com/