
This content is reproduced from the Center for the Advanced Study of Communities and Information website.
Last weekends Theorizing the Web 2011 conference (TTW2011) was a great time. I’ve been working along with Ben Shneiderman and Marc Smith on developing techniques and tools (namely NodeXL [1]) to make sense of social media data – particularly relational data from sites like Twitter and Facebook ([2], [3]). I thought I’d take the opportunity to do a bit of quick-and-dirty analysis and visualizations of the Twitter network around the conference. Here are a few snapshots. I’d love to hear reactions and thoughts on ideas for further analyses and reactions of how well these visualizations represented conference attendees’ experiences.

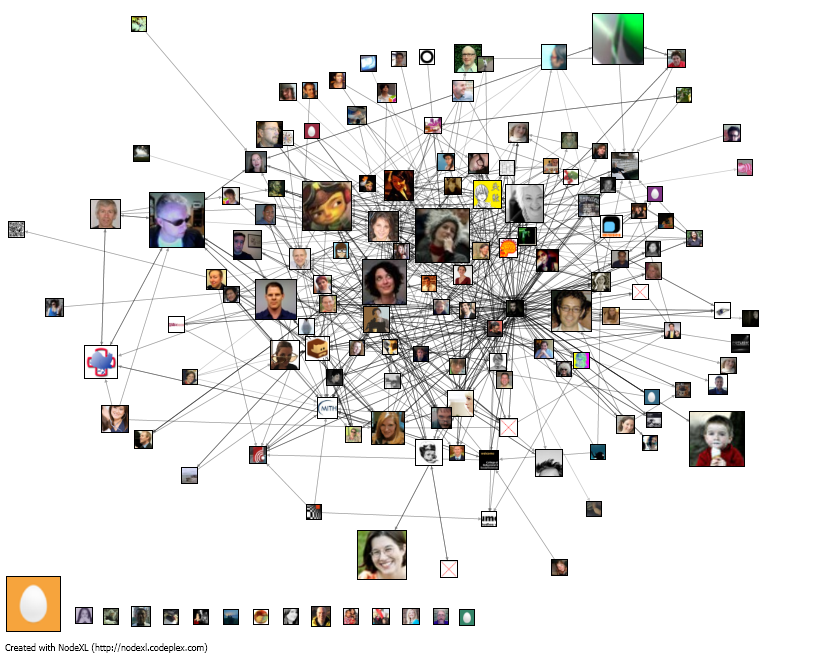
The first visualization shows the 148 users who followed or were followed by @ttw2011 at 6:30am on 4/9/2011 (Saturday morning, the day of the main conference). Nodes are connected by arrowed edges (directed ties) that point from a user toward the other users they follow on Twitter. Node Size is based on betweenness centrality, which highlights people who play important bridge-spanning roles by connecting many people who would not otherwise be as directly connected. This one shows that: 1. @zephoria (dana boyd) was an excellent choice for a keynote because (a) most followers of @ttw2011 (81 of the 148) knew and followed her already prior to the conference suggesting their interest in staying aware of content that she posts, and (b) she has followers from people all over the network (i.e., not just one clump of people in a particular discipline), and (c) she has a lot of total Twitter followers suggesting that she can draw attention to others about the ttw2011 conference (see next image). 2. @nathanjurgenson and @pjrey, the conference organizers, play important bridge-spanning roles within the community. Incidentally, they show up very close to one another in the layout because they have similar friendship networks. 3. Other people with high betweenness often provide unique connections to a handful of people from a particular disciplinary or geographical area. These include: @techsoc, @saskiasassen, @jessienyc, @mkirschenbaum, @umd_mith, @shakmatt, @carlacasilli. While I don’t know all of these people, I do know that @mkirschenbaum and @umd_mith point to digital humanities scholars and @shakmatt (me) points to people affiliated with CASCI.
Of course there are other metrics that can determine one’s “importance” in a network. The next image is identical to the first except that it sizes based on total Twitter followers. The main characters in this view are mostly different, with the exception of @zephoria who has over 43,000 followers. The next most followed are peripheral members: @19sixty3 (43,000+) only connected to @nathanjurgenson and @thomas_lyndt (24,000+) who isn’t connected to any others. Others are a mix of core and peripheral members.
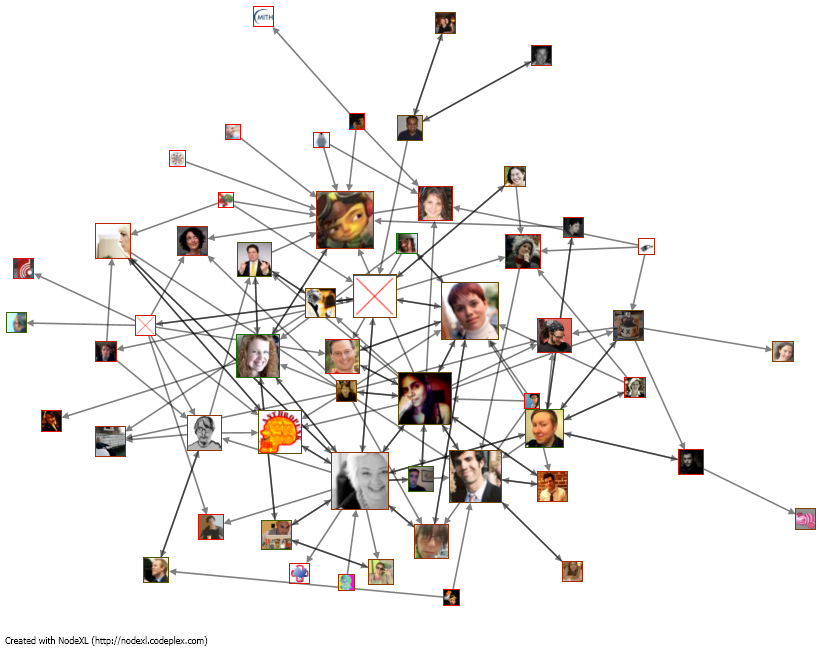
Another way to look at the conference is to focus on the change in the network that resulted from the conference. I grabbed data from 7:55am on 4/11/2011 (Monday morning, two days after the conference). By this time 172 users were followed by or followed @ttw2011. Those in both networks garnered 1.7 new followers at the conference, with most people not receiving any new followers and some receiving many: @zephoria (17), @jessienyc (13), @techsoc (12), @academicdave (11), @nathanjurgenson (10), and @msanastasia (10). The next visualization only shows all of the new ties created among individuals who were in the pre-conference and post-conference network. The size of the images is based on the In-Degree, which in this case is the total number of new followers a person garnered from among this subset of users.
I looked for subgroups of these members who cluster together into distinct subgroups and was a bit surprised given the interdisciplinary nature of the conference that there weren’t more distinct clusters. Even after removing the conference organizers and zephoria there aren’t clear clusters due to bridge spanners such as @techsoc, @jessienyc, @mkirschenbaum, @academicdave, @saskiasassen
Of course, there are some serious limitations with all of these data since they are only based on conference attendees who chose to follow (or were followed by) @ttw2011. Another analysis that is possible is to look at all messages that used the hashtag #ttw2011. But, even so, it’s a decent method for identifying some of the most important people in the network (based on different metrics of importance).
Derek Hansen (@shakmatt) is an assistant professor in the University of Maryland’s iSchool and the director of the Center for the Advanced Study of Communities and Information.
Comments 1
Reflections on Theorizing the Web « PJ Rey's Sociology Blog Feed — April 22, 2011
[...] 2,187 tweets (click here for more analysis). Derek Hansen, an assistant professor in the iSchool, made a visualization of the new connections made at the [...]