Today, the Senate Committee on Banking, Housing, and Urban Affairs convenes an open hearing on “Fostering Economic Growth: The Role of Financial Companies.” This spurred us to revisit research on how economic opportunities for African Americans has unfolded in the United States. This brief was originally prepared for the Council on Contemporary Families Online Symposium on Civil Rights February 4-6, 2014.
Introduction.
In 1963, Rev. Dr. Martin Luther King, Jr. made his famous “I Have a Dream” speech at the March on Washington, the momentous demonstration that helped spur passage of the Civil Rights Act the following year. He described African Americans as living “on a lonely island of poverty in the midst of a vast ocean of material prosperity.” A half-century after the Civil Rights Act we can assess how much progress African-Americans have made in key areas such education, employment, income, health, and longevity.
Certainly, many African Americans have moved into positions of power that were scarcely imaginable when Dr. King gave his speech. In 1964 there were only 100 Black elected officials in the country. By 1990 there were 10,000. Since then there have been two Black Secretaries of State, and America’s first African-American president is now in his second term.
The number of Black households earning $100,000 a year or more has increased by 500 percent in the past 50 years, to about one-in-ten of Black households. African Americans have even headed several Fortune 500 companies. Examples include Dr. Clifton R. Wharton, Jr., former Chairman and CEO of TIAA-CREF, Ursula M. Burns, Chairman and CEO of Xerox Corp., Kenneth I. Chenault, Chairman and CEO at American Express, and Kenneth C. Frazier, President and CEO of Merck & Co. Inc. Many African Americans have also attained unprecedented wealth, status, and respect in the news, entertainment, and sports industries.
Yet despite these individual attainments, African Americans remain heavily underrepresented in the highest ranks of the business world, comprising barely one percent of the CEOs of the Fortune 500. Oprah Winfrey is the only African American on the Forbes 400 richest Americans list. And in the lower echelons of the income ladder, racial economic disparities have been remarkably persistent and gotten worse in a few respects.
Education.
Over the past 50 years, there has been considerable progress in the educational attainments of African Americans, although they still lag behind the levels of Whites. In 1966, the high school completion rate of African Americans was just a little more than half that of White Americans. By 2012 it was almost 95 percent that of Whites. In 1966, fewer than four percent of African Americans, compared to more than ten percent of Whites, had college degrees. By 2012, the percentage of African Americans with college degrees had risen to 21.2, compared to 31.3 percent for Whites (U.S. Census, Education and Social Stratification Branch, 2013). See figures below (click to expand).
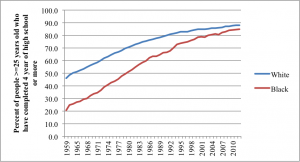
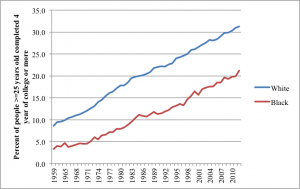
But after declines in school segregation during the 1970s and 1980s, progress leveled off and even reversed in some areas. In 1968, 76.6 percent of African American children attended segregated schools. In 2012, 74 percent of African American children were in segregated schools, 15 percent of them in schools where less than one percent of the student body was White (Orfield, Kucsera, & Siegel-Hawley, 2012). Majority Black schools are generally characterized by lower funding, lower teacher quality, and higher drop-out rates than majority White schools (The Leadership Conference on Civil and Human Rights, 2013).
Employment and Income.
There have been significant improvements in employment opportunities for African Americans over the past half century. In 1960, only 6.7 percent of African Americans in the labor market were in professional and managerial positions, compared to 26 percent of Whites (Smith & Welch, 1977). By contrast, in 2012, 30 percent of employed African Americans were in professional and managerial positions, compared to 39 percent of employed Whites (U.S. Bureau of Labor Statistics, 2012). African American women have made especially significant gains and are now more likely than their male counterparts to occupy professional and managerial positions.
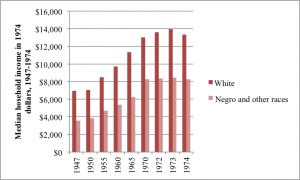
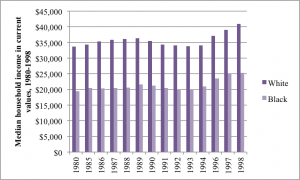
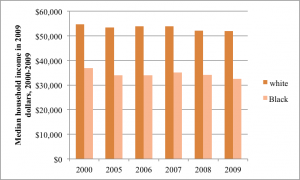
However, African Americans professionals earn significantly less than their White peers, and African American women in such occupations earn less than their male counterparts. In 2012, the median weekly earnings for African American women who worked in “management, professional, and related occupations” were $838, compared to $958 for White women, $1,021 for African American men, and $1,339 for White men (U.S. Bureau of Labor Statistics, 2012). See bottom of page for charts on median household income in historically and recently by race.
Overall, despite absolute progress in Black earnings, the income gap between Blacks and Whites remains large. In 1963, African American workers earned 55 cents for every dollar earned by Whites. By 2012, that had risen to 78.4 cents, leaving Blacks still more than 20 percent behind (U.S. Bureau of Labor Statistics, 2013).
The wealth gap is even higher, due to the lower value of homes in predominantly black communities and the much smaller access of African Americans to any accumulated wealth of parents and grandparents. The median wealth of White households is ten times as large as that of Black households.
Educational disparities may explain some of the remaining gap in pay equity. We have come some distance from the 1960s, when African Americans with a four-year college degree earned less than White men with only a high school diploma (Katz & Stern, 2006; Taylor, 1981). Today, by contrast, being college graduate counts for more than being a White man in determining earnings.
Yet as late as 2012, African American men and women still earned less than their White peers with the same level of education. For male college graduates over age 25, Whites’ weekly earnings were $1,399, compared to $1,086 for African Americans. College–graduated Black women, aged 25 years and older, had weekly earnings of $913, compared to $1,012 for White women with similar educational attainment. White men with a high school diploma earned over $150 more a week than similarly-educated African American men — $760 vs. $604 per week. In fact, a Black man with an associate’s degree earns, on average, $15 per week less than a White man with only a high-school diploma (U.S. Bureau of Labor Statistics, 2013).
Unemployment and Poverty.
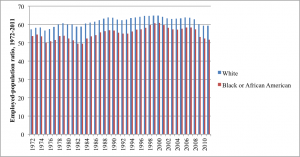
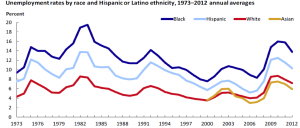
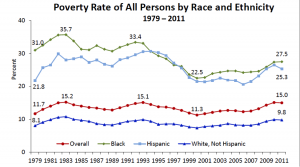
African Americans are also more likely to lose their jobs during economic downturns (see figures below; click to expand). Despite ups and downs in unemployment for all racial and ethnic groups, the Black unemployment rate has consistently been twice as high as that of Whites since the 1950s.
Social and Institutional Disparities.
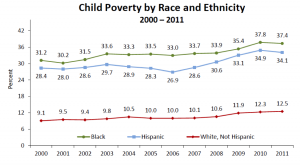
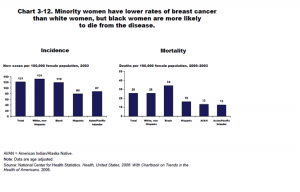
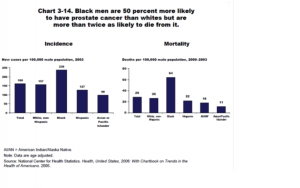
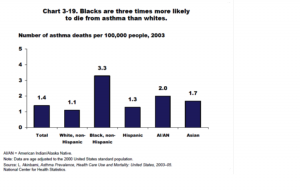
African American children are at greater risk than their White counterparts for numerous problems associated with growing up in poverty, (e.g., poor prenatal health care, malnutrition, poor quality housing, and exposure to environmental toxins). This helps explain why African Americans are disproportionately affected by chronic illnesses, such as cancer, heart disease, and diabetes, and, because of lack of access to quality health care, are more likely to die from these illnesses and diseases (Mead, Cartwright-Smith, Jones, Ramos, Woods, & Siegel, 2008). Blacks are three times as likely to die from asthma as Whites. Black women are less likely than White women to develop breast cancer, but more likely to die from it (Mead et al, 2008). And Black maternal mortality rates are three to four times higher than rates for Whites. (See end of paper for charts of racial and ethnic health disparities by race.)
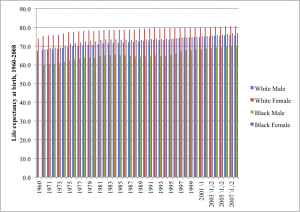
While life expectancies for all Americans have greatly improved over time, African Americans continue to have a shorter life expectancy than Whites. In 2008, there was a 5.5 year gap between African American and White men, and a 3.8 year gap between African American and White women (U.S. Census, 2010). African American men have the shortest life expectancy at birth of all Americans across racial and ethnic groups (see figure below; click to expand).
Incarceration.
The rate of imprisonment is one area where there has been significant deterioration for African Americans in the past half-century. Incarceration rates among African American men are three times higher than 50 years ago and the disparity between incarceration rates for African Americans and Whites has continued to grow. African American men are more likely to be arrested and receive longer sentences for nonviolent drug crimes than Whites committing similar or more serious offenses. In consequence, African Americans, who are just ten percent of the overall U.S. population, represent 35.4 percent of the prison population, with an incarceration rate more than six times higher than Whites. One in three African American men can expect to go to prison at some point in his life time, compared to one in 17 White men. (Pettit & Western, 2004).
Conclusion.
As we reflect on the state of African Americans 50 years after the passage of the Civil Rights Act, it is clear that despite the progress made in many arenas of life, African Americans are still burdened by the legacy of slavery, segregation, and discrimination. In fact, it may be that the dramatic successes of a minority of Blacks have made it harder for Americans to recognize the continuing disparities and injustices facing the remainder.
Originally posted 1/21/15
For further information, contact Velma McBride Murry, Professor and Betts Chair, Human and Organizational Development Dept., Vanderbilt University; velma.m.murry@vanderbilt.edu.
References
Centers for Disease Control and Prevention (2010). National Center for Health Statistics. U.S. Department of Health and Human Services.
Eggebeen, D. J., & Lichter, D. T. (1991). Race, family structure, and changing poverty among American children. American Sociological Review, 801-817.
Gabe, Thomas (2013). Poverty in the United States: 2012. Congressional Research Service (CRS) based on U.S. Census Bureau 2012 and 2011 American Community Survey (ACS) data.
Katz, Michael and Stern, Mark, One Nation Indivisible (2006). Russell Sage, p. 95.
King, Martin Luther; King, Coretta Scott (2008). The Words of Martin Luther King, Jr.: Second Edition. Newmarket Press. p. 95.
Lichter, D., ZHENCHAO, Q., & Crowley, M. (2006). Race and poverty: Divergent fortunes of America’s children?. Focus, 24(3), 8-16.
Loeber, R., Pardini, D., Homish, D.L., Wei, E.H., Crawford, A.M., Farrington, D.P., et al. (2004). The prediction of violence and homicide in young men. Journal of Consulting and Clinical Psychology, 76, 1074–1088
Mead, H., Cartwright-Smith, L., Jones, K., Ramos, C., Woods, K., & Siegel, B. (2008). Racial and ethnic disparities in US health care: A chart book. Commonwealth Fund New York.
Orfield, G., Kucsera, J., & Siegel-Hawley, G. (2012). E Pluribus… Separation: Deepening Double Segregation for More Students. Civil Rights Project/Proyecto Derechos Civiles.
Pettit, B., & Western, B. (2004). Mass imprisonment and the life course: Race and class inequality in U.S. incarceration. American Sociological Review, 69, 151-169.
Roscigno, V. J., Williams, L. M., & Bryon, R. A. (2012). Workplace racial discrimination and middle class vulnerability. American Behavioral Scientist, 56, 696-710.
Sawhill, I., Winship, S., & Grannis, K. (2012). Pathways to the middle class: Balancing personal and public responsibilities. Washington, DC: Brookings.
Smith, J. P., & Welch, F. R. (1977). African American/White Male Earnings and Employment: 1960-70. In Distribution of Economic Well-Being (pp. 233-302). NBER.
Taylor, D. E. (1981). Education, on-the-job training, and the African American-white earnings gap. Monthly Lab. Rev., 104, 28.
The Leadership Conference on Civil and Human Rights (2013). Still segregated: How race and poverty stymie the right to education. http://civilrightsdocs.info/pdf/reports/Still_Segregated-Shadow_Report.pdf.
Washington, James M. (1991). A Testament of Hope: The Essential Writings and Speeches of Martin Luther King, Jr. HarperCollins. Pp. 365–67.
Wolff, Edward N. (2010). Recent trends in household wealth in the United States: Rising debt and the middle-class squeeze-An update to 2007, working paper, Levy Economics Institute, No. 589
U.S.Census of Bureau, Education and Social Stratification Branch, (2013). CPS data on educational attainment: http://www.census.gov/hhes/socdemo/education/data/cps/historical/index.html.
U.S. Bureau of the Census (1974, 1994, 1996, 1997, 1998). Current Population Reports: Income, Poverty, and valuation of Noncash Benefits.
U.S. Bureau of the Census, (2012). Statistical Abstract of the United States, 2012. http://www.census.gov/compendia/statab/2012/tables/12s0691.pdf.
U.S. Department of Health & Human Services, (2012). ASPE issue brief: Information on poverty and income statistics: A summary of 2012 current population survey data. http://aspe.hhs.gov/hsp/12/povertyandincomeest/ib.shtml.
U.S. National Center for Health Statistics, (2010). National Vital Statistics Reports (NVSR), Deaths: Preliminary data for 2008, Vol, 59, No.2.
U.S. Bureau of Labor Statistics, (2013). Labor force characteristics by race and ethnicity, 2012. http://www.bls.gov/cps/cpsrace2012.pdf.
Additional Charts

Comments