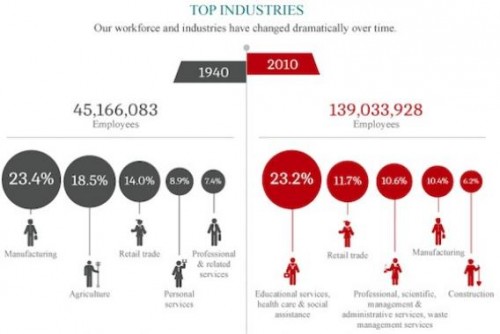
Matthew Yglesias posted an image from an infographic released by the Census Bureau showing differences in the U.S. population between 1940 and 2010. This section of the graphic focuses on changes in the industries in which the U.S. workforce is employed. For instance, in 1940 23.4% of Americans worked in manufacturing, down to 10.4% in 2010:
Education, health, and social services have emerged as a major employment sector. On the other hand, while agriculture is a minor sector today (in terms of % of people employed), in 1940 nearly 1 in 5 people worked in agriculture. As Yglesias says,
…this drives home the fact that the initial exclusion of agricultural workers from Social Security [as part of the New Deal in the 1930s] was a really major compromise.


Comments 8
Max Kingsbury — March 29, 2012
The graphic is sadly illegible.
Ari Feldman — March 29, 2012
If you click on it, it will be easier to read. This is a strong graphic for supporting the idea that our education system needs to adapt to the changes in industry.
Masonsummar92 — March 29, 2012
this is a crazy image of employment change in the past 70 years... as an agriculture major it's sad to see agriculture not on the percentage scale in this image. employment is as needed throughout a civilization and will always open opportunities for any industry so their is always hope for any employment i believe whether you have to look for it or not. surprising though is the educational employment increase as of 2010. then again civilization has come along way since then.
Emily Holloway — March 29, 2012
The 1940 side adds up to 72.2%, the 2010 side to 62.1%. Every category of work mentioned fits within the portion left out. This graphic gives incomplete information.
Judging from the totals given, I'd say this is people in the workforce. I'm not sure if the data is people 18-65, or people who claim to be in the workforce or looking for work. Just what exactly are those 27.8% or 37.9% of people doing? Are the unemployed among them?
Today's unemployment rate is 8.3, so (assuming this counts the unemployed) what is about a third of the workforce doing? If they're not teaching or healing people, selling people things, managing people, or building them things... then what are these people doing? I've heard of a knowledge economy, but is about a third of our workforce in this knowledge industry? And if so, are they cut into such small categories that it doesn't show up?
Changes in U.S. Spending Patterns | Environmental, Health and Safety News — April 7, 2012
[...] we posted a comparison of the types of jobs Americans held in 1940 and 2010, based on Census data. Now NPR has posted an interesting image showing how spending on different [...]
ewa — October 28, 2013
great presentation
thehvls — April 26, 2020
Whenever you are looking forward to buy the HVLS fans in your budget, then without going for a second thought, go with ambica. Also, people who want to purchase it, then click here. Hopefully, you can make your purchase done easily.
Thehvlsceilfan — May 26, 2020
When you are looking for the best HVLS industrial ceiling fans for a long time, then it is necessary for the people HVLS industrial fans to have a look at the good industries like ambika at any time. Well, it is all up to your choice.