
When I think back on the Feminine Mystique, I am reminded of my favorite childhood television show, “Bewitched,” which featured a beleaguered housewife and witch, Samantha Stevens. As partner in her husband Darrin’s “two-person career,” holding a job of her own was out of the question. She was on call to whip up fabulous meals for Darrin’s boss and his clients at a moment’s notice – yet she wasn’t even supposed to use her superpowers to add a tasty dessert. She spent her days cooking, cleaning and helping her husband’s career, all the while proudly avoiding magical shortcuts. She had the requisite two children, but they mostly sat in the background, being supervised by a witchy relative or their babysitter, Esmeralda. more...
Archive: Nov 2014
In the late 1970s, after a long period of holding fairly steady, the gap in wages between men and women began improving. In 1979, the median hourly wage for women was 62.7 percent of the median hourly wage for men; by 2012, it was 82.8 percent. However, a big chunk of that improvement – more than a quarter of it — happened because of men’s wage losses, rather than women’s wage gains. more...
Cross posted on the Family Inequality blog.
Disability is a very broad concept, representing a wide array of conditions that are not easily captured in a simple demographic survey. However, disabilities are very prevalent, especially in an aging society, and the people who experience disabilities differ in important ways from those who do not. Previously I reported — in a preliminary way — that people with disabilities are much more likely to divorce than those without. Here I present some numbers on marriage rates.
This isn’t the kind of thorough, probing analysis this subject requires. But I have two reasons to do it now. First is that I hope to motivate other people to pursue this issue in greater depth. And second, I want to highlight the importance of the data I’m using — the American Community Survey (ACS) — because it might be not available for much longer. These questions have been slated for demolition by the U.S. Census Bureau on cost-saving grounds. I put details about this issue — and how to register your opinion with the federal government — at the end of the post.
Disabilities
The ACS asks five disability questions (I put the shorthand label after each):
- Is this person deaf or does he/she have serious difficulty hearing? (Hearing)
- Is this person blind or does he/she have serious difficulty seeing even when wearing glasses? (Vision)
- Because of a physical, mental, or emotional condition, does this person have serious difficulty concentrating, remembering, or making decisions? (Cognitive)
- Does this person have serious difficulty walking or climbing stairs? (Ambulatory)
- Does this person have difficulty dressing or bathing? (Independent living)
These aren’t perfect questions, but they cover a lot of ground, and the ACS — which involves about 3 million households — can’t get into too much detail.
One great thing about having these questions on the giant ACS is you can use the data to get all the way down to the local level, or into small race/ethnic groups. And with the marital events questions, you can combine disability information and marriage information.
First-marriage rates
Using marital events (did you get married in the last year), marital history (how many times have you been married), detailed race and ethnicity breakdowns, and the disability questions above, I produced the following figure. This uses the combined 2008-2012 ACS data because these are small groups, but even with five years of data these groups get quite small. There are about 90,000 non-Hispanic Whites with a cognitive disability in my sample, but only 356 people who are both White and American Indian with a hearing disability (the smallest group I included). This sample is people ages 18-49 who have never been married (or just got married).
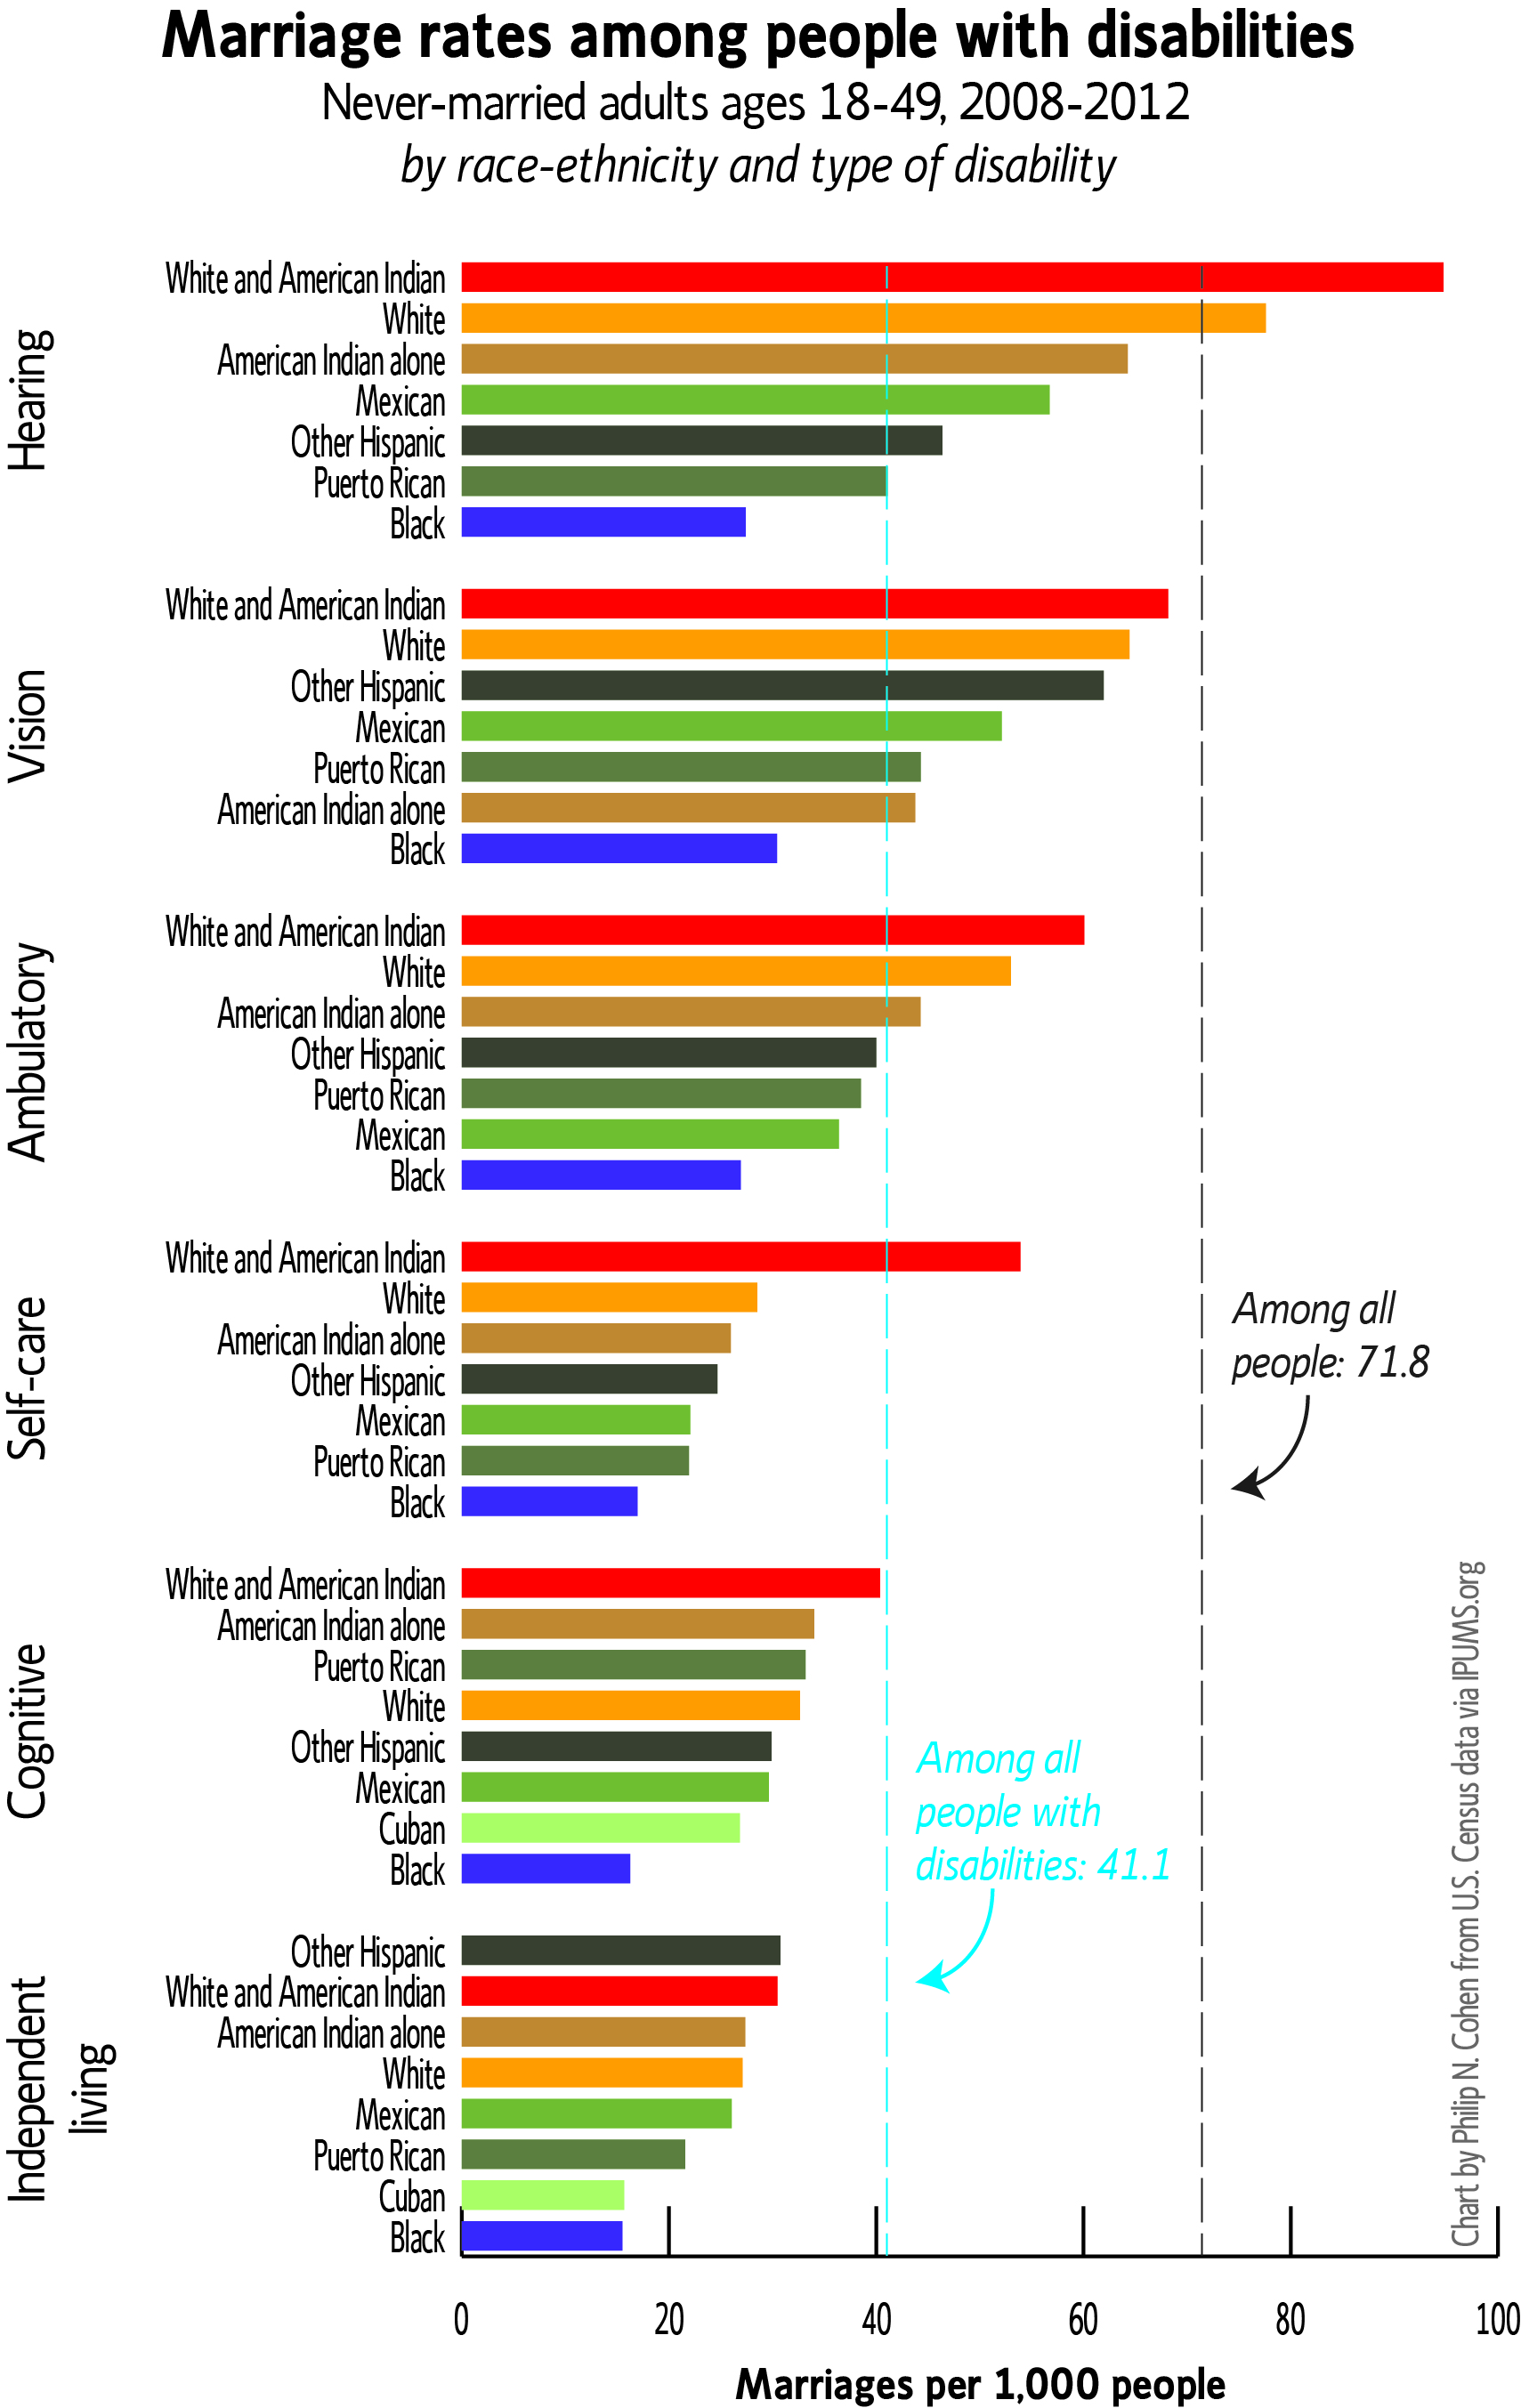
The overall first-marriage rate for people ages 18-49 is 71.8 per 1,000. For people with disabilities it’s 41.1 (shown by the blue line). So that’s much lower than for the general population. But there is a very wide variation across these groups, from 15.5 per thousand for Blacks with disabilities in independent living all the way up to above the national average for Whites and White/American Indians with hearing disabilities. (For every condition, Blacks with disabilities have the lowest marriage rates.)
I don’t draw any conclusions here, except that this is an important subject and I hope more people will study it. Also, we need data like this.
In previous posts demonstrating the value of this data source, I wrote about:
- Divorce generally
- Divorce for “millennials” in 25 cities
- Divorce for Asian Americans from different national origins
Whether you are a researcher or some other member of the concerned public, I hope you will consider dropping the government a line about this before the end of the year.
The information about the planned cuts to the American Community Survey is here: https://www.federalregister.gov/articles/2014/10/31/2014-25912/proposed-information-collection-comment-request-the-american-community-survey-content-review-results:
Direct all written comments to Jennifer Jessup, Departmental Paperwork Clearance Officer, Department of Commerce, Room 6616, 14th and Constitution Avenue NW., Washington, DC 20230 (or via the Internet at jjessup@doc.gov).
Comments will be accepted until December 30.
Why do women earn less than men? Research points to a number of different explanations, but one of the central factors remains women’s caregiving responsibilities. The wages of childless men and women have been converging steadily over the last three decades – but mothers continue to earn significantly less, while fathers earn a bit more. These motherhood and fatherhood effects have been stable over time while childless women’s wages have been rising, even though mothers are increasingly likely to be employed. more...
Husbands and wives who share similar levels of education now enjoy a lower risk of divorce than those in which husbands have more education—a trend consistent with a shift toward egalitarian marriages. This brief was part of the Gender Revolution Rebound Symposium first published July, 2014.
The prevailing view for the past several years has been that the gender revolution stalled in the 1990s. In that decade, there was a flattening or slowdown in many trends associated with progress toward gender equality: women’s labor force participation, women’s entry into male-dominated occupations, reductions of the gender pay gap, and egalitarian gender attitudes.
But recent research throws doubt on the conclusion that the gender revolution has stalled. Through the 1990s and 2000s, for example, one trend that did not slow was women’s increasing educational advantage over men. more...
In the late 1970s, after a long period of holding fairly steady, the gap in wages between men and women began improving. In 1979, the median hourly wage for women was 62.7 percent of the median hourly wage for men; by 2012, it was 82.8 percent. However, a big chunk of that improvement – more than a quarter of it — happened because of men’s wage losses, rather than women’s wage gains. more...
Cross posted on the Family Inequality blog.
Disability is a very broad concept, representing a wide array of conditions that are not easily captured in a simple demographic survey. However, disabilities are very prevalent, especially in an aging society, and the people who experience disabilities differ in important ways from those who do not. Previously I reported — in a preliminary way — that people with disabilities are much more likely to divorce than those without. Here I present some numbers on marriage rates.
This isn’t the kind of thorough, probing analysis this subject requires. But I have two reasons to do it now. First is that I hope to motivate other people to pursue this issue in greater depth. And second, I want to highlight the importance of the data I’m using — the American Community Survey (ACS) — because it might be not available for much longer. These questions have been slated for demolition by the U.S. Census Bureau on cost-saving grounds. I put details about this issue — and how to register your opinion with the federal government — at the end of the post.
Disabilities
The ACS asks five disability questions (I put the shorthand label after each):
- Is this person deaf or does he/she have serious difficulty hearing? (Hearing)
- Is this person blind or does he/she have serious difficulty seeing even when wearing glasses? (Vision)
- Because of a physical, mental, or emotional condition, does this person have serious difficulty concentrating, remembering, or making decisions? (Cognitive)
- Does this person have serious difficulty walking or climbing stairs? (Ambulatory)
- Does this person have difficulty dressing or bathing? (Independent living)
These aren’t perfect questions, but they cover a lot of ground, and the ACS — which involves about 3 million households — can’t get into too much detail.
One great thing about having these questions on the giant ACS is you can use the data to get all the way down to the local level, or into small race/ethnic groups. And with the marital events questions, you can combine disability information and marriage information.
First-marriage rates
Using marital events (did you get married in the last year), marital history (how many times have you been married), detailed race and ethnicity breakdowns, and the disability questions above, I produced the following figure. This uses the combined 2008-2012 ACS data because these are small groups, but even with five years of data these groups get quite small. There are about 90,000 non-Hispanic Whites with a cognitive disability in my sample, but only 356 people who are both White and American Indian with a hearing disability (the smallest group I included). This sample is people ages 18-49 who have never been married (or just got married).
The overall first-marriage rate for people ages 18-49 is 71.8 per 1,000. For people with disabilities it’s 41.1 (shown by the blue line). So that’s much lower than for the general population. But there is a very wide variation across these groups, from 15.5 per thousand for Blacks with disabilities in independent living all the way up to above the national average for Whites and White/American Indians with hearing disabilities. (For every condition, Blacks with disabilities have the lowest marriage rates.)
I don’t draw any conclusions here, except that this is an important subject and I hope more people will study it. Also, we need data like this.
In previous posts demonstrating the value of this data source, I wrote about:
- Divorce generally
- Divorce for “millennials” in 25 cities
- Divorce for Asian Americans from different national origins
Whether you are a researcher or some other member of the concerned public, I hope you will consider dropping the government a line about this before the end of the year.
The information about the planned cuts to the American Community Survey is here: https://www.federalregister.gov/articles/2014/10/31/2014-25912/proposed-information-collection-comment-request-the-american-community-survey-content-review-results:
Direct all written comments to Jennifer Jessup, Departmental Paperwork Clearance Officer, Department of Commerce, Room 6616, 14th and Constitution Avenue NW., Washington, DC 20230 (or via the Internet at jjessup@doc.gov).
Comments will be accepted until December 30.
Why do women earn less than men? Research points to a number of different explanations, but one of the central factors remains women’s caregiving responsibilities. The wages of childless men and women have been converging steadily over the last three decades – but mothers continue to earn significantly less, while fathers earn a bit more. These motherhood and fatherhood effects have been stable over time while childless women’s wages have been rising, even though mothers are increasingly likely to be employed. more...
Husbands and wives who share similar levels of education now enjoy a lower risk of divorce than those in which husbands have more education—a trend consistent with a shift toward egalitarian marriages. This brief was part of the Gender Revolution Rebound Symposium first published July, 2014.
The prevailing view for the past several years has been that the gender revolution stalled in the 1990s. In that decade, there was a flattening or slowdown in many trends associated with progress toward gender equality: women’s labor force participation, women’s entry into male-dominated occupations, reductions of the gender pay gap, and egalitarian gender attitudes.
But recent research throws doubt on the conclusion that the gender revolution has stalled. Through the 1990s and 2000s, for example, one trend that did not slow was women’s increasing educational advantage over men. more...