Asian Americans are the fastest growing group in the United States. The Asian American population increased from 0.7 percent in 1970 to 6 percent in 2015 alone. By 2065, demographers project that Asian Americans will more than double in size, accounting for 14 percent of the U.S. population (U.S. Census Bureau, 2012). Driving this growth is immigration; China and India have surpassed Mexico as the leading sources of new immigrants to the United States. Demographers project that by 2065, Asian immigrants will comprise 38 percent of the country’s foreign-born population. While their rapid population growth has caught the attention of demographers, their visible presence on college campuses has caught the imagination of the American public.
At Ivy League universities like Harvard, Yale, and Princeton, more than one-fifth of the entering class is Asian American. In elite public universities like the University of California, Berkeley, Asian Americans constitute more than 40 percent of the student body. Astounding figures like these generate the belief that all Asian Americans attain exceptional educational outcomes, but data disaggregation by ethnic group reveals a more sobering reality.
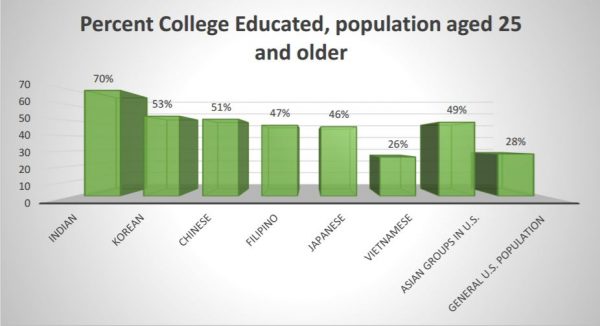
Comprised of more than 20 detailed origins, Asian Americans exhibit a range of educational profiles. On the high end of the educational spectrum are Indians, Chinese, and Koreans, who attain more education than native-born Whites. For example, about 70 percent of Indian adults in the United States have a college degree or higher—which is two and a half times as high as the 28 percent U.S. national average. Among Chinese and Koreans, the college graduation rates are well above the U.S. average at 51 and 53 percent, respectively (DeSilver 2014).
At the other end of the educational spectrum are Southeast Asian groups such as Cambodian, Laotian, and Hmong students who have higher high school dropout rates than African Americans and Latinos. As the disaggregation in Figure 1 reveals, there is enormous ethnic heterogeneity among Asian Americans (Ramakrishnan and Ahmad 2014).
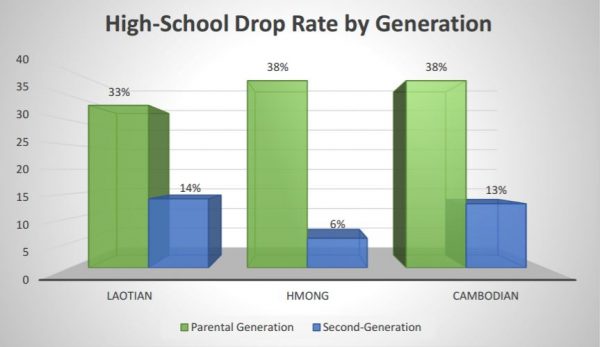
But disaggregating data by ethnic group alone fails to capture three important, yet untold, stories about the mobility patterns among Asian Americans. First, generational status matters, and second-generation Asian Americans have made considerable gains in educational attainment. For example, Figure 2 shows that only 15 percent of first-generation Cambodians have attained a college degree, but by the second generation, this figure nearly doubles to 27 percent. Moreover, the high school drop-out rate falls from 38 percent in the first generation to 13 percent in the second.
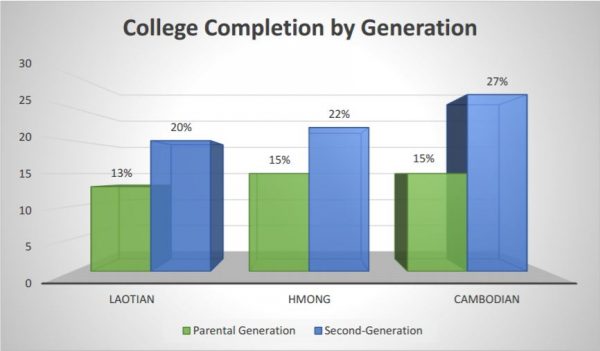
Similarly, the college graduation rates among first-generation Laotian and Hmong are 13 and 15 percent, respectively, but in the second generation, they increase to 20 and 22 percent. As shown in Figure 3, The high school drop-out rates decrease significantly among these groups as well: 33 percent and 38 percent of Laotian and Hmong immigrants do not complete high school, but only a generation later, these figures fall to 14 and 6 percent. Hence, these Southeast Asian groups make remarkable intergenerational progress from the first to the second generation—a point that gets lost when we compare their educational attainment to other Asian ethnic groups.
Second, gender matters. Second-generation Southeast Asian females outpace their male counterparts. For example, while 23 percent of second-generation Cambodian women enroll in college, the comparable figure for second-generation males is only 19 percent (Feliciano and Rumbaut 2005). Moreover, Laotian females in high school show higher grade-point averages than their male counterparts, and they are also more likely to report that they expect to earn college degrees (Feliciano 2012). For these groups, there appears to be not only a second-generation “female advantage,” but also possibly a “male disadvantage” (DiPrete and Buchmann 2013).
Third, while second-generation Indians attain the highest level of education of all Asian groups, they attain less than their first-generation counterparts, and could be depicted as downwardly mobile and, therefore, unsuccessful. How we measure success matters. When we consider “starting points” and evaluate how far one generation exceeds the next, second-generation Cambodian, Laotian, and Hmong immigrants are more successful than second-generation Indians.
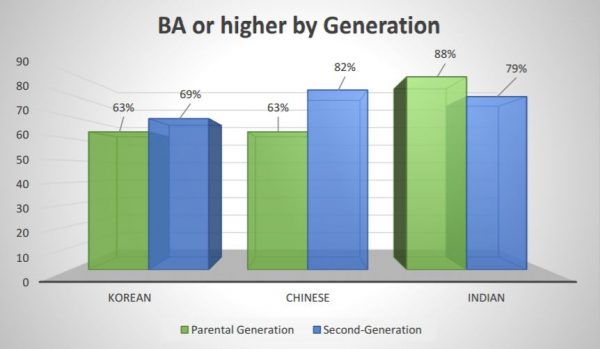
Beginning their quest for mobility from less favorable starting points, we cannot expect Southeast Asian groups—like Cambodians, Laotians, and Hmong—to reach parity with their more advantaged Asian ethnic counterparts in a single generation. And while they far to go before reaching parity with other Asian groups, or even with native-born Whites and Blacks, failing to notice the enormous intergenerational progress they have made gives an incomplete portrait of their educational progress. That the second-generation Cambodians, Laotians, and Hmong have attained levels of education that far exceed that of their immigrant parents is the untold success story of Asian American achievement.
References
Cynthia Feliciano. 2012. “The Female Educational Advantage Among Adolescent Children of Immigrants.” Youth & Society 44(3): 431–49.
Cynthia Feliciano and Rubén G. Rumbaut. 2005. “Gendered Paths: Educational and Occupational Expectations and Outcomes among Adult Children of Immigrants.” Ethnic and Racial Studies 28(6): 1087–1118
Drew DeSilver. 2014. “5 Facts about Indian Americans.” Pew Research Center.
Karthick Ramakrishnan and Farah Z. Ahmad, “Education: The State of Asian Americans and Pacific Islanders.” Center for American Progress.
Thomas A. DiPrete and Claudia Buchmann. 2013. The Rise of Women: The Growing Gender Gap in Education and What It Means for American Schools. New York: Russell Sage Foundation.

Comments