politics: election 2012

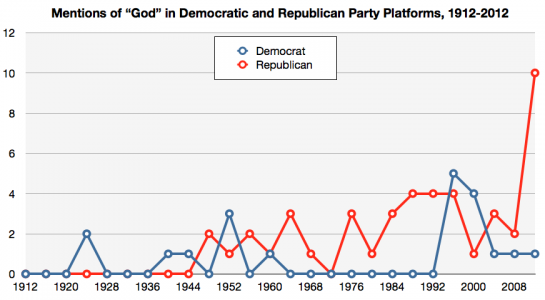
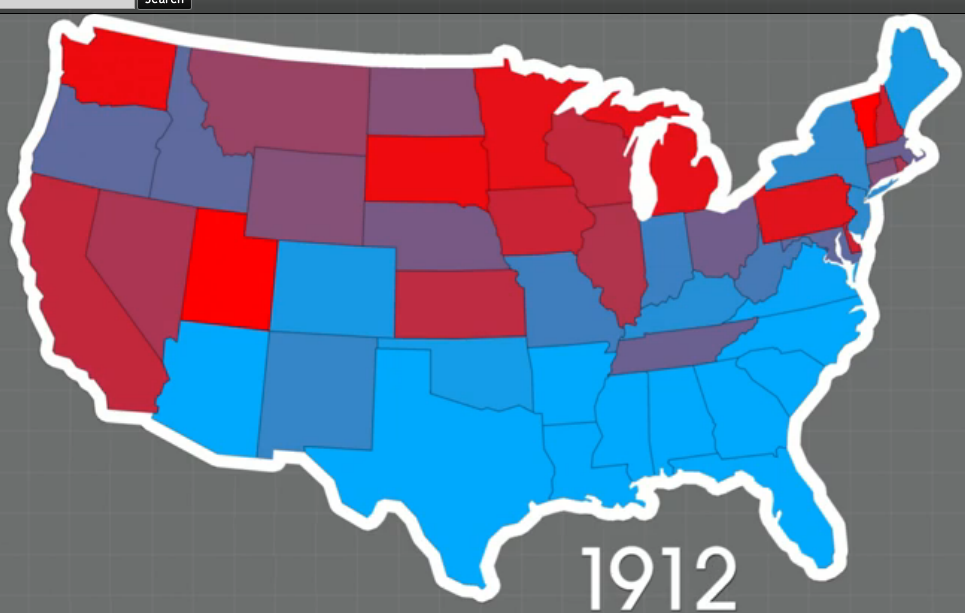
Salon posted a video by Benjamin Wheelock that illustrates changing voting patterns in the U.S. over the last century. He assigned each state a color based on voting for presidents, governors, and Congress for each year there were elections. Red indicates Republican, blue is Democratic; the darker the color, the more overwhelming the vote was for that party.

The video starts with 2011 and moves backward to 1912. What’s perhaps most striking today is that through the late 1970s, the South was a swath of Democratic blue. In the 1980s much of it turns purple, as presidential elections increasingly go Republican but Dems remain competitive in state elections. By the 2000s, it becomes much more solidly, and brightly, red as Republicans consolidate their popularity in the region.

It’s a quick way to highlight many major trends and turning points in U.S. political history, including changing stances on racial issues within the parties, the Democrats’ overwhelming dominance during the late ’30s as the country struggled to emerge from the Great Depression, and the clear shifts in the South and on the coasts over time.

Thanks to my colleague Pete for pointing it out!

Cross-posted at Caroline Heldman’s Blog.

On Monday, Mother Jones released a video recorded in May of presidential candidate Mitt Romney speaking at a $50,000-a-plate fundraiser in the Boca Raton home of “private equity party boy” and “sexy party” host, Marc Leder. A hidden camera caught controversial remarks about IsraelIran, and a joke about being more electable if his parents had been born in Mexico, but the topic of this post is Romney’s use of the 47% Meme.

The 47% Meme is the idea that half of Americans take from rather than contribute to tax coffers. It sometimes surfaces in the form of the “takers vs. makers” frame. I have encountered this “argument” for years on Fox News, so it is surprising to see it gaining national attention now. Romney did a superb job articulating the 47% Meme in response to a question of how he might win in November:

There are 47 percent of the people who will vote for the president no matter what. All right, there are 47 percent who are with him, who are dependent upon government, who believe that they are victims, who believe the government has a responsibility to care for them, who believe that they are entitled to health care, to food, to housing, to you-name-it. That that’s an entitlement. And the government should give it to them.

Many myths start with a kernel of truth. The 47% Meme is loosely based on the statistic that 47% of Americans pay no income tax (down to 46% in 2011). This meme is wildly dishonest since people pay a host of other federal, state, and local taxes. It’s about as honest as saying a person doesn’t eat vegetables because she only eats carrots, celery, bell peppers, cucumbers, and cabbage, but not broccoli.

So who is paying taxes, and what taxes are they paying?


Federal Income Tax

The Tax Policy Center finds that two main groups comprise the 46% who do not pay federal income tax: (1) The poor whose subsistence-level income is not taxable, and (2) those who receive tax expenditures. This chart shows that the lion’s share of tax expenditures goes to senior citizens, children, and the working poor, with the notable exception of 7,000 millionaires who paid no income tax in 2011.


Other Federal Taxes

But enough about income tax since this narrow focus only serves to further the misleading 47% Meme. The chart below shows a more accurate picture of who pays federal taxes. If we don’t count retirees, only 8% of Americans pay no income or payroll taxes.

Americans also pay federal excise tax on gas, liquor, cigarettes, airline tickets, and a long list of other products, so virtually every American pays federal taxes in some form. And contrary to the 47% Meme, poor and middle-class Americans actually pay a greater percentage of their income in federal payroll and excise taxes than wealthier Americans.

State and Local Taxes

When it comes to state and local taxes, the Institute on Taxation and Economic Policy finds that the poor pay more in state and local taxes in every state except Vermont. As the chart below indicates, state and local taxes are regressive, meaning that those who can least afford to pay, pay more.

Romney has apologized for the inelegance of his statements, but stands by their substance, despite ample data debunking the dependency (above) and entitlement bases for the 47% Meme. I don’t believe that Romney believes that half of the people in the U.S. are pathetically entitled “victims.” He is a smart person, and this is a ludicrous line of reasoning. But what does it say about our bitterly partisan nation that heaping unmitigated scorn on the poor brings in big bucks from the base?

Peter N. sent in some data compiled by Chris Cillizza of the Washington Post.  It reveals the intersection of race and religion among Democrats and Republicans.   As Cillizza concludes, it’s “overblown” to say that the Republican party is made up of White Protestants and the Democratic of minorities and atheists, but there is definitely an argument to be made that each party is disproportionately so.

This first pie chart shows the racial and religious affiliation of people who identify with or lean towards the Republican party.  More than half are White Protestants, another 18% are White Catholics.  Only a small percentage of party faithfuls are religious Blacks and Hispanics (the two racial groups featured in in these data).

This second chart shows the same data for Democrats and Democratic-leaning individuals.  Almost a quarter of Democrats are White Protestants, but a slightly larger percentage of Democrats are religiously unaffiliated.  One in five Democrats identifies as either Black or Hispanic and religious.  The larger “other” category conceals smaller blocs that nonetheless add diversity to the party.

This is just one way to slice the pie, so to speak, but these are the kinds of data that both the Obama and the Romney campaigns are working with.  When they aim to bring out their “base,” this is what they’re talking about.  These numbers may give us a clue as to why they pick the strategies they do, such as the sudden spike in the inclusion of the word “God” in the Republican party platform.

Lisa Wade, PhD is an Associate Professor at Tulane University. She is the author of American Hookup, a book about college sexual culture; a textbook about gender; and a forthcoming introductory text: Terrible Magnificent Sociology. You can follow her on Twitter and Instagram.

If you followed media coverage of the Democratic party convention last week, you may have heard about the short-lived controversy that broke out over the lack of the word “God” in the party platform (as well as the platform not explicitly mentioning Jerusalem as the capital of Israel). Fox News picked up on the lack of religious references and highlighted it as a major failing. Both items were hastily added to the platform.

Over at Organizations, Occupations and Work, Chris Prener posted a graph showing the number of times “God” appears in the party platforms over the last century. As Prener mentions, explicit references to a deity  were rare before World War II. After including it a few times in the ’40 and ’50s, the Democratic party platform mostly left it out until the 1996. The Republican party has much more consistently included “God” at least once in each platform since 1948, but 2012’s platform stands out, since it has more than double the mentions as in any prior platform:

Using the word “God” in official party platforms isn’t a tradition inherited from the earliest days of the two parties. It’s a relatively recent change, illustrating a trend toward more explicit inclusion of or reference to religion in U.S. politics and by political candidates.

Cross-posted at Montclair SocioBlog.

The New York Times ran these graphics showing the word frequencies of the Republican and Democratic conventions.  I’ve added underlining on the keywords that seem to differentiate the two conventions. (The data on the Democrats runs only through Sept. 4, but it looks like the themes announced early on will be the ones that are repeated.)

Both parties talked about leadership, the economy, jobs, and families.  More interesting are the differences.  Democrats talked a lot about Women, a word which seems to be absent from the Republican vocabulary.  The Democrats also talked about Health and Education.  I find it curious that Education does not appear in the Republican word cloud.

The Republican dictionary falls open to the page with Business – ten times as many mentions as in the Democrats’ concordance.  If you go to the interactive Times graphic, you can click on Business and see examples of the contexts for the word.  Many of these excerpts also contain the word Success.

You can put the large-bubble words in each graphic in a sentence that condenses the party’s message about government, though that word – Government – does not appear in either graphic.   For the Republicans, government should lower Taxes so that Business can Succeed, creating Jobs.

For the Democrats, government should protect the rights of Women and ensure that everyone has access to Health and Education.

Perhaps the most telling most interesting word in the Democratic cloud is Together.  The Republican story is one of individual success in business, summed up in their repeated phrase, “I built that.”  The Democrats apparently are emphasizing what people can accomplish together.  These different visions are not new.  They go back at least to the nineteenth century.  (Six years ago, I blogged here about these visions as NFL brands — Cowboys and Steelers — and their parallels in US politics.)

(HT: Neal Caren who has posted his own data about the different balance of emotional expression at the two conventions.)

Cross-posted at Montclair SocioBlog.

About two weeks ago, Chris Hayes said, “It is undeniably the case that racist Americans are almost entirely in one political coalition and not the other.”

The case, it turns out, is very deniable.  Alex Tabarrok at Marginal Revolution denied it with data from the 2002 and 2008 General Social Survey (GSS).  He looked at three questions…

  • Favor laws against interracial marriage
  • Would vote for a Black for president
  • Blacks should not be pushy

…and concludes:

It is undeniable that some Americans are racist but racists split about evenly across the parties.

Hayes then tweeted a retraction.

End of story?

To begin with, the sample sizes Tabarrok uses are small.  In the 2002 GSS, only 87 respondents went on record against interracial marriage, and in 2008, only 80 said they wouldn’t vote for a Black for president.  (All the tables and graphs presented here and in Tabarrok’s post are based on Whites only.)

Only about 5% of the sample takes the racist response to these items.  But I would run the table differently.  Instead of asking what percent of each party is racist, I would ask where do those few racists go.

The differences are small, but the edge goes to the Republicans.

Second, there is a difference between party identification and political ideology.  If you ask not about party but about political views, the differences become sharper.

The GSS has other questions that might stand as a proxy for racism.  For example:

On the average (negroes/blacks/African-Americans) have worse jobs, income, and housing than white people. Do you think these differences are because most (negroes/blacks/African-Americans) just don’t have the motivation or willpower to pull themselves up out of poverty?

Again, the differences are small, with White Republicans slightly more likely (50% vs. 45%) to say Blacks’ economic problems are caused by lack of motivation and will power.  And again, the differences are larger when the independent variable is political ideology rather than party identification.

In that same GSS question about the cause of Black economic troubles, another choice is:

Do you think these differences are mainly due to discrimination?

The differences for both Party ID and Political views are clear.  White Democrats and liberals are much more likely to see discrimination as a major cause.

But is this racist?  Not necessarily.  It might well be part of a general view of the causes of human behavior, one that emphasizes personal factors (ability, motivation, etc.) and downplays structural forces the individual has little power over (discrimination).   Conservatives might use that same  explanation for unemployment and low income among Whites as well.  But I do not know of any GSS questions about the causes of White economic problems.  (Perhaps these exist, but I am not a GSS expert.)

We do know that racists (those who say they would not vote for a Black president) are more likely to take the conservative position on the “Willpower” explanation (76% vs. 50%) and on the Discrimination explanation (78% vs. 64%) compared with those who say yes, they would vote for a Black president.  But that does not mean that the other conservatives who agree with them and who deny that racial discrimination affects the lives of Black people are also racists. People can come to the same position from different places.  But people can also hide their racism behind seemingly non-racial issues.  In the 1960s ,70s, and 80s, many observers thought that the Republicans were using first school busing and then crime as a proxy for race, as Republican strategist Lee Atwater famously explained.  And some observers today (Tom Edsall, for example) argue that the Republicans are using welfare in the same way this time around.

Other bloggers have written about the questions Hayes raised — Tabarrok has links to three of these.  The most interesting I’ve come across is Will Wilkinson’s (here).  His original views apparently were individual-centered and much in line with Margaret Thatcher’s dictum that “there is no such thing as society.”  But that was “when I was a Rand-toting libertarian lad.”

He has now come to see that individuals, with their ideas and attitudes and “non-coercive” behavior, can add up to something greater than the sum of its parts, i.e, society.  But he got to this idea by walking down the left fork of the libertarian road – the road not to serfdom but to sociology.

Eventually I realised that actions that are individually non-coercive can add up to stable patterns of behaviour that are systematically or structurally coercive, depriving some individuals of their rightful liberty. In fact, rights-violating structures or patterns of behaviour are excellent examples of Hayekian spontaneous orders—of phenomena that are the product of human action, but not of human design.

Originally posted at YouGov.

Race has recently taken center stage in the presidential campaign.  From Joe Biden’s suggestion that a Romney-Ryan presidency would re-enslave African-Americans, to some liberal commentators’ contentions that the Romney campaign is using racial code words like “welfare” and “anger” to mobilize anti-black sentiments against President Obama, charges and counter-charges of playing the race card now abound.

Part of this racialized turn in the campaign involves Romney’s welfare ad earlier this month—an ad that questionably accused Obama of ending welfare for work requirements.  While that charge may seem race-neutral, there is a long-standing and strong association in white Americans’ minds between welfare and “undeserving” African-Americans (see here and here).  According to Jonathan Chait, then, “the political punch of this messaging derives from the fact that white middle-class Americans understand messages about redistribution from the hard-working middle-class to the lazy underclass in highly racialized terms.”  An extensive body of social science research described as racial priming seems to support Chait’s contention.  That research shows that such code words as “welfare” and “inner-city,” especially when combined with racial imagery (e.g., the hardworking whites in Romney’s ad), can make racial attitudes a more central determinant of political evaluations (see: 12345).  One might therefore expect the welfare ad to activate racial attitudes in public opinion.

We can test that expectation thanks to some unique experimental data collected last week by YouGov.  The survey randomly assigned half of its 1,000 respondents to view the Romney welfare ad (see above) while the remaining half of the sample did not see the ad.  Respondents then answered a series of questions to discern whether and how the ad affected their opinions.  Unfortunately, these follow-up questions did not include vote choice or candidate favorability, which were asked earlier in the survey.  We did, however, ask respondents how well Mitt Romney and Barack Obama’s policies would benefit the following groups in society: the poor, the middle class, the wealthy, African-Americans and white Americans.  Answers were then recoded to range from 0 (“hurt them a great deal”) to 100 (“help them a great deal”).

The welfare ad did not appear to affect people’s overall answers to those questions.  However, it did make attitudes toward blacks a stronger predictor of respondents’ views about the consequences of Romney’s policies for the poor, the middle class, and African-Americans.  To measure attitudes toward blacks, we use a scale called “racial resentment” in the scholarly literature.  For respondents to this survey, we actually assessed racial resentment much earlier, when these respondents were first interviewed in a December 2011 survey.  The four questions that make up this measure are here.

The figure below shows that there was almost no relationship between racial resentment and the opinions of people who did not see the ad.  But among those who saw it, racial resentment affected whether people thought Romney will help the poor, the middle class, and African-Americans.  Moreover, seeing the ad did not activate other attitudes, such as party or ideological self-identification.  It only primed racial resentment:

(Note: Predicted values were calculated from OLS coefficients by setting partisanship, ideology, and race to their sample means.  Source: YouGov Survey, August 2012)

At the same time, the ad failed to “racialize” views of whether Romney’s policies would benefit whites and the wealthy.  This likely stems from the fact that Romney favorability ratings are strongly related to thinking his policies will help the poor, the middle class, and blacks, but only weakly related to believing he’d help whites and the wealthy.

Interestingly, the ad did not appear to further racialize the perceived consequences of Obama’s policies, either.  This is probably because racial attitudes are already linked to Obama, and a single political ad isn’t enough to significantly strengthen an already strong relationship.

Nevertheless, the results from our experiment suggest that ads like the one in this post may well contribute to the growing polarization of public opinion by racial attitudes beyond the voting booth in the age of Obama.

[I thank Brendan Nyhan for suggesting a study of this topic, and John Sides and Lynn Vavreck for help in designing the survey questions.]

—————

Michael Tesler is Assistant Professor of Political Science at Brown University and co-author of Obama’s Race:The 2008 Election and the Dream of a Post-Racial America.

The Washington Post and the Kaiser Family Foundation released the results of a survey of 3,130 adults about their position on same-sex marriage. The survey found that just over half of all adults and registered voters thought same-sex couples should be able to get married:

Unsurprisingly, this varies greatly by political affiliation, with Democrats and Republicans mirroring each other — 2/3rds of Democrats support same-sex marriages, while the same proportion of Republicans oppose it. Well over half of Independents also agree that same-sex marriage should be legal:

You can also see the results by party clusters — that is, different groups within the parties (the Post unfortunately doesn’t describe the clusters). Urban liberals were most supportive (93%), while those identifying with the Tea Party were least (6%):

These numbers tell us a lot about why the Democratic party appears to be on the verge of adopting a platform that explicitly includes marital equality as a goal. This position is unlikely to alienate many people within the party or Independents who might lean Democratic, since only a small minority of both groups “strongly” oppose same-sex marriage. We’re at a point where a major political party can make the calculation that openly stating they support allowing gay and lesbian couples to get married helps its political chances more than it potentially hurts them.

Via the New Civil Rights Movement.