Search results for census

At Pew Social Trends, Gretchen Livingston has a new report on fathers staying at home with their kids. They define stay at home fathers as any father ages 18-69 living with his children who did not work for pay in the previous year (regardless of marital status or the employment status of others in the household). That produces this trend:

1 (2) - Copy

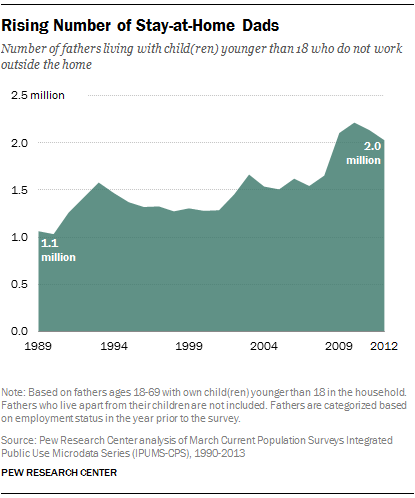
At least for the 1990s and early-2000s recessions, the figure very nicely shows spikes upward of stay-at-home dads during recessions, followed by declines that don’t wipe out the whole gain — we don’t know what will happen in the current decline as men’s employment rates rise.

In Pew’s numbers 21% of the stay at home fathers report their reason for being out of the labor force was caring for their home and family; 23% couldn’t find work, 35% couldn’t work because of health problems, and 22% were in school or retired.

It is reasonable to call a father staying at home with his kids a stay at home father, regardless of his reason. We never needed stay at home mothers to pass some motive-based criteria before we defined them as staying at home. And yet there is a tendency (not evidenced in this report) to read into this a bigger change in gender dynamics than there is. The Census Bureau has for years calculated a much more rigid definition that only applied to married parents of kids under 15: those out of the labor force all year, whose spouse was in the labor force all year, and who specified their reason as taking care of home and family. You can think of this as the hardcore stay at home parents, the ones who do it long term, and have a carework motivation for doing it. When you do it that way, stay at home mothers outnumber stay at home fathers 100-to-1.

I updated a figure from an earlier post for Bryce Covert at Think Progress, who wrote a nice piece with a lot of links on the gender division of labor. This shows the percentage of all married-couple families with kids under 15 who have one of the hardcore stay at home parents:

SHP-1. PARENTS AND CHILDREN IN STAY-AT-HOME PARENT FAMILY GROUPS

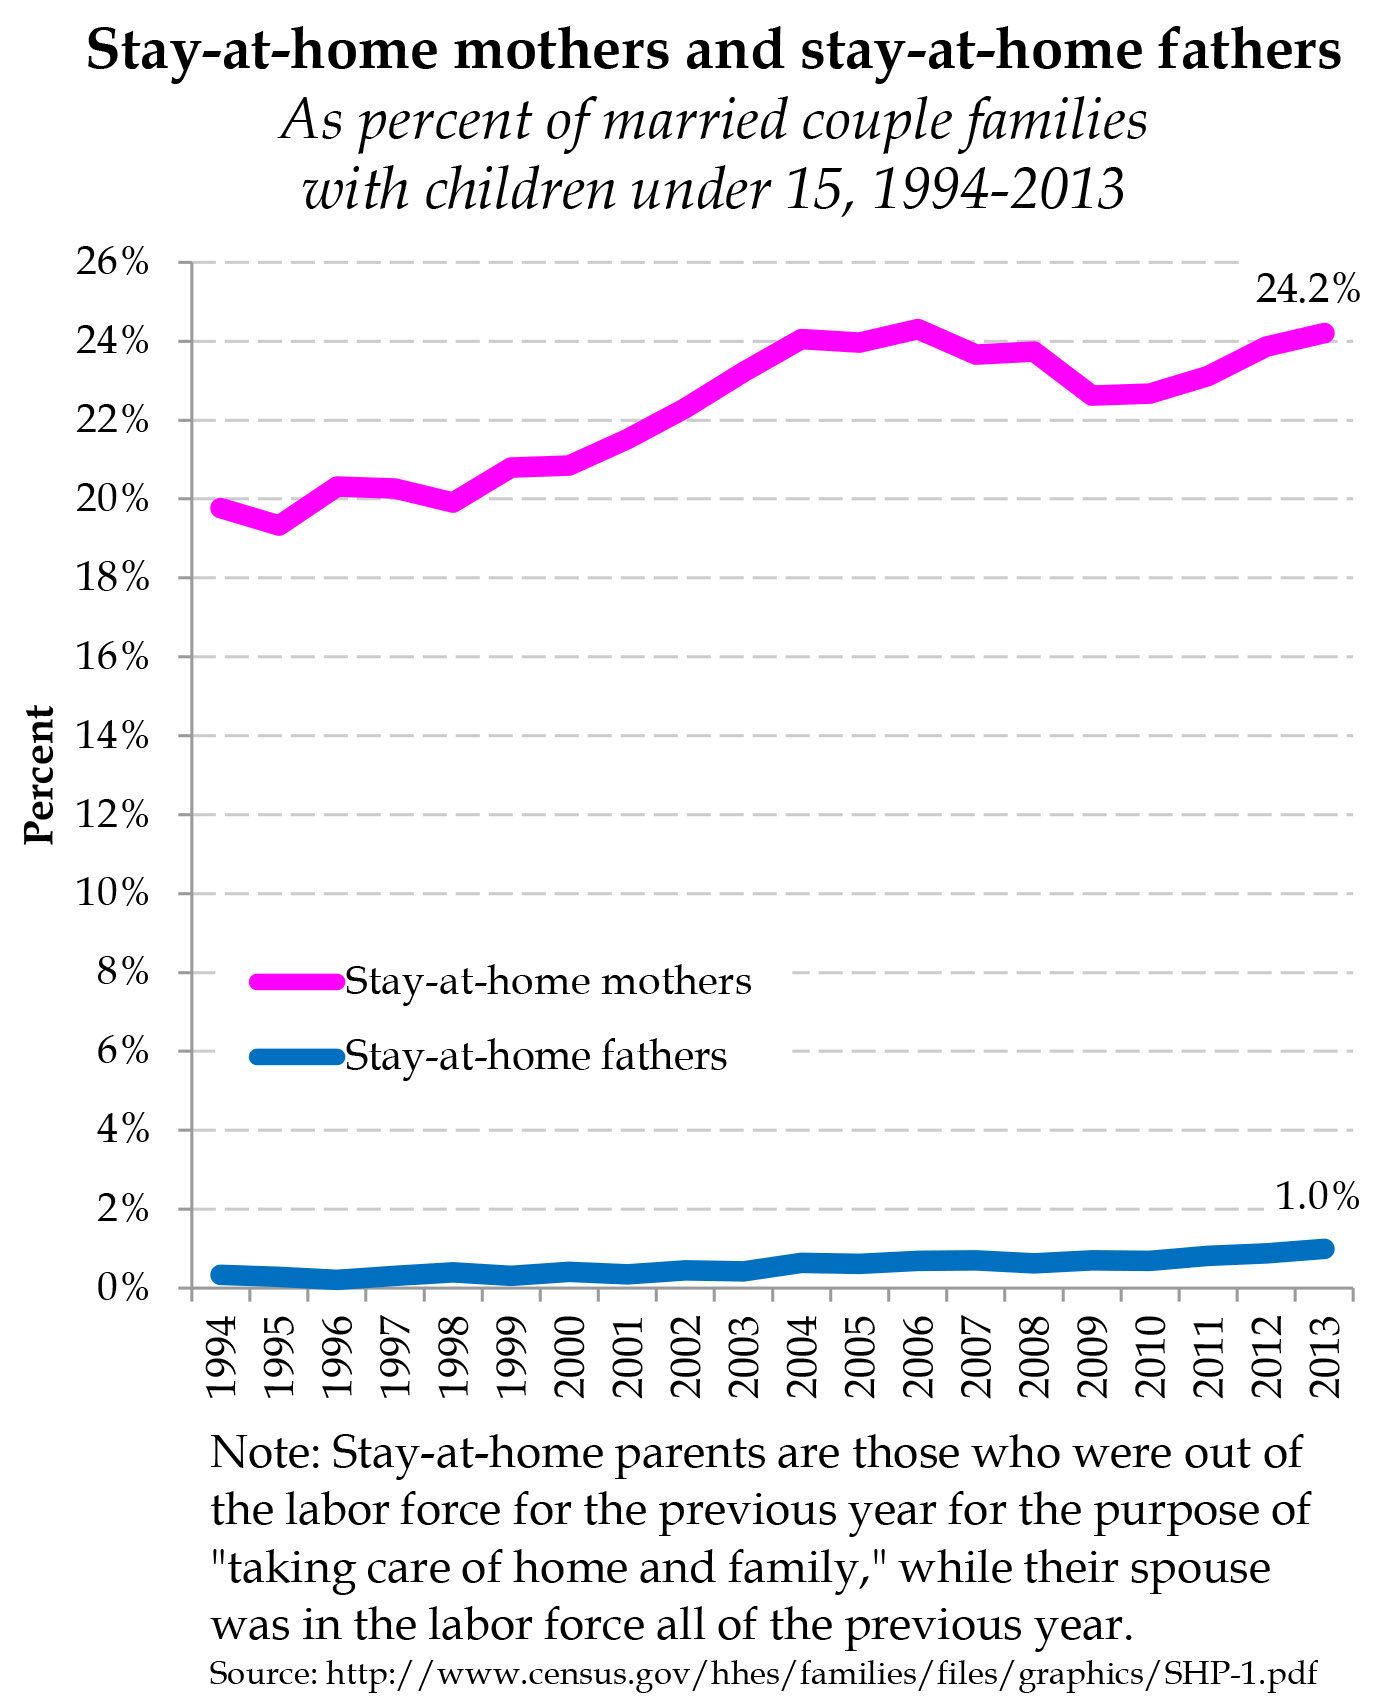
That is a real upward trend for stay at home fathers, but that pattern remains very rare.

See the Census spreadsheet for yourself here.  Cross-posted at Pacific Standard.

Philip N. Cohen is a professor of sociology at the University of Maryland, College Park, and writes the blog Family Inequality. You can follow him on Twitter or Facebook.

Screenshot_2
Happy Graduation, Seniors! Congratulations! What’s next?  Below is some sociologically-inspired, out-of-the-box advice on work, love, family, friendship, and the meaning of life.  For new grads from the two of us!

1. Don’t Worry About Making Your Dreams Come True

College graduates are often told: “follow your passion,” do “what you love,” what you were “meant to do,” or “make your dreams come true.”  Two-thirds think they’re going find a job that allows them to change the world, half within five years.  Yikes.

This sets young people up to fail. The truth is that the vast majority of us will not be employed in a job that is both our lifelong passion and a world-changer; that’s just not the way our global economy is. So it’s ok to set your sights just a tad below occupational ecstasy.  Just find a job that you like.  Use that job to help you have a full life with lots of good things and pleasure and helping others and stuff.  A great life is pretty good, even if it’s not perfect.

2. Make Friends

Americans put a lot of emphasis on finding Mr. or Ms. Right and getting married. We think this will bring us happiness.  In fact, however, both psychological well-being and health are more strongly related to friendship.  If you have good friends, you’ll be less likely to get the common cold, less likely to die from cancer, recover better from the loss of a spouse, and keep your mental acuity as you age.  You’ll also feel more capable of facing life’s challenges, be less likely to feed depressed or commit suicide, and be happier in old age.  Having happy friends increases your chance of being happy as much as an extra $145,500 a year does.  So, make friends!

3. Don’t Worry  about Being Single

Single people, especially women, are stigmatized in our society: we’re all familiar with the image of a sad, lonely woman eating ice cream with her cats in her pajamas on Saturday night. But about 45% of U.S. adults aren’t married and around 1 in 7 lives alone.

This might be you.  Research shows that young people’s expectations about their marital status (e.g., the desire to be married by 30 and have kids by 32) have little or no relationship to what actually happens to people.  So, go with the flow.

And, if you’re single, you’re in good company.  Single people spend more time with friends, volunteer more, and are more involved in their communities than married people. Never-married and divorced women are happier, on average, than married women. So, don’t buy into the myth of the miserable singleton.

4. Don’t Take Your Ideas about Gender and Marriage Too Seriously

If you do get married, be both principled and flexible.  Relationship satisfaction, financial security, and happy kids are more strongly related to the ability to adapt in the face of life’s challenges than any particular way of organizing families.  The most functional families are ones that can bend.  So partnering with someone who thinks that one partner should support their families and the other should take responsibility for the house and children is a recipe for disaster.  So is being equally rigid about non-traditional divisions of labor.  It’s okay to have ideas about how to organize your family – and, for the love of god, please talk about both your ideals and fallback positions on this – but your best bet for happiness is to be flexible.

5. Think Hard About Whether to Buy a House

Our current image of the American Dream revolves around homeownership, and buying a home is often taken for granted as a stage on the path to full-fledge adulthood. But the ideal of universal home ownership was born in the 1950s.  It’s a rather new idea.

With such a short history, it’s funny that people often insist that buying a house is a fool-proof investment and the best way to secure retirement.  In fact, buying a house may not be the best choice for you. The mortgage may be less than rent, but there are also taxes, insurance, and the increasingly common Home Owners Association (HOA) fees. You may someday sell the house for more than you bought it but, if you paid interest on a mortgage, you also paid far more than the sale price.  You have freedom from a landlord, but may discover your HOA is just as controlling, or worse.  And then there’s the headache: renting relieves you from the stress of being responsible for repairs. It also offers a freedom of movement that you might cherish.

So, think carefully about whether buying or renting is a better fit for your finances, lifestyle, and future goals. This New York Times rent vs. buy calculator is a good start.

6. Think Even Harder about Having Kids

One father had this to say about children: “They’re a huge source of joy, but they turn every other source of joy to shit.” In fact, having children correlates with both an increased sense of purpose in life and a long-lasting decrease in individual and marital happiness.  Having kids means spending a lot of your short life and limited income on one source of joy. It’s not a bad decision. But it’s also not the only good decision you can make. We want to think we can “have it all” but, in fact, it’s a zero sum game. You have only so much time and money and there are lots of ways to find satisfaction, pleasure, and meaning in this life.  Consider all your options.

Lisa Wade is a professor of sociology at Occidental College. You can follow her on Twitter and Facebook.  Gwen Sharp is a professor of sociology at Nevada State College. You can follow her on Twitter.

Originally posted in 2013 and cross-posted at The Huffington Post and PolicyMic (with gifs!).


By now most readers are likely familiar with the idea that the American middle class is shrinking.  Most income and wealth gains over the past 40 or so years have gone to the richest Americans, while poverty is spreading and getting deeper.  As a result, the percent of Americans who can reasonably claim to be middle class is shrinking.

I found a fantastic animation illustrating this process in the neighborhoods of the city of Chicago.  Borrowing data from education scholar Sean Reardon and sociologist Kendra Bischoff, Daniel Hertz calculated where the  median family income of each Census tract fell relative to the entire metropolitan area.  Orange tracts are ones where the median family income is 0-45% of the median for Chicago as a whole (struggling families), dark green tracts are ones where the median is 200% or more (resource rich families).  Grey is, literally, middle class.

For simplicity’s sake, here is 1970 and 2012 right next to one another.  Notice that the 1970 map involves a lot more grey (middle class) and the 2012 map involves a lot more green (rich) and especially orange (poor).

1


Here’s the animation:

1For another interesting measure of the shrinking middle class, see our post showing increases in high paying and low paying jobs, but decreases in jobs that pay middle income wages.

Lisa Wade, PhD is an Associate Professor at Tulane University. She is the author of American Hookup, a book about college sexual culture; a textbook about gender; and a forthcoming introductory text: Terrible Magnificent Sociology. You can follow her on Twitter and Instagram.

1 (2) - Copy
U.S. Army celebrates “Hispanic Month” (source: wikimedia)

One may well wonder where the term “Hispanic,” and for that matter, “Latino,” came from. The press and pundits are all abuzz about the Hispanic vote, Hispanic organizations, and Hispanic cultural influences. Back in the mid-twentieth century, however, they wrote about Mexicans or Puerto Ricans or Guatemalans, not about Hispanics. Of course, people of Latin American origin have become far more numerous in the United States since then and the immigration itself brings more attention. Nonetheless, the labels have changed. Starting in the 1970s, the media rapidly adopted the “pan-ethnic” term Hispanic, and to a lesser degree, Latino, and slowed down their use of specific national labels.*  So did, organizations, agencies, businesses, and “Hispanics” themselves.

As recounted in her important new book, Making Hispanics, sociologist (and my colleague) G. Cristina Mora tells the story of how people as diverse as Cuban-born businessmen in Miami, undocumented Mexican farm workers in California, and third-generation part-Puerto Ricans in New York who do not even understand Spanish were brought together into one social category: Hispanic-Americans.

Politics, Business, and Government

Mora describes an alliance that emerged in the 1970s among grassroots activists, Spanish-language broadcasters, and federal officials to define and promote “Hispanic.”

Activists had previously stressed their national origins and operated regionally – notably, Mexicans in the southwest (where the term “Chicano” became popular for a while) and Puerto Ricans in the northeast. But the larger the numbers they could claim by joining together, the more political clout, the more governmental funds, and the more philanthropic support they could claim. Pumping up the numbers was particularly important given their latent competition with African-American activists over limited resources and limited media attention. Some pan-ethnic term promised to yield the biggest count.

Spanish-language television broadcasters, notably Univision, looked to expand their appeal to advertisers by delivering them a national market. Although the broadcasters faced obstacles in appealing to Spanish-language viewers across the country differing significantly in programming tastes and dialects, they managed to amalgamate the audiences by replacing content imported from abroad with content developed in the United States. They could then sell not medium-to-small Mexican-, Cuban-, or Puerto Rican-American audiences to advertisers, but one huge Hispanic-American audience.

Making the term official as a census category helped both activists and entrepreneurs. Previously, the Bureau of the Census classified Latin Americans as whites with distinct national origins, usually poorly measured. The activists pressed the census bureau, as did some politicians, to provide as broad a label as possible and count everyone who might conceivably fit the category, including, for example, the African-origin Dominicans (although not the French-speaking Haitians nor the Portuguese-speaking Brazilians). This pressure led to the 1980 formulation, used ever since, in which the census asks Americans whether or not they are “Hispanic” separately from whether they are white, black, Asian, or Indian.

Univision social media ad (source):

Univision-Social Media Ad

The three interest groups worked together to publicize and promote the idea and the statistical category of “Hispanic.” As Mora explains, leaving the label’s meaning somewhat ambiguous was useful in both expanding the numbers and in selling the category – as a large needy population to the government and as numerous, affluent consumers to advertisers. The three parties also campaigned to get other institutions, such as state vital statistics bureaus and big businesses to adopt Hispanic as an official category. Many so-called Hispanics preferred and still prefer to call themselves by their national origins; Mora quotes a 1990s bumper sticker, “Don’t Call Me Hispanic, I’m Cuban!” But the term has taken over.

And, so Hispanic-Americans matter a lot now.

Identities

Categories of people that we take to be fixed – for example, our assumptions that people are old or young, black or white, male or female – often turn out to be not fixed at all. Social scientists have documented the way the definition of Negro/African American/black has shifted over the generations. There was a time, for example, when the census bureau sought to distinguish octoroons and a time when it could not figure out how to classify people from the Indian subcontinent. In Making Hispanics, Mora lets us see close up just how this new category, Hispanic, that we now take to be a person’s basic identity, was created, debated, and certified.

Direct Marketing Ad

One lesson is that it could have been otherwise. If the pace and sources of migration had been different or if the politics of the 1970s had cut differently, maybe we would be talking about two separate identities, Chicano and “Other Spanish-speaking.” Or maybe we would be classifying the darker-skinned with “Blacks” and lighter-skinned with “Whites.” Or something else. Making Hispanics teaches us much about the social construction of identity.

* Based on my analysis of statistics on New York Times stories and the nGram data on words in American books. Use of “Chicano” surged in 1960s and 1970s, but then faded as “Latino” and, especially, “Hispanic” rose.

Claude S. Fischer is Professor of Sociology at the University of California, Berkeley and the author of Made in America: A Social History of American Culture and Character.  This post originally appeared at his blog of the same name.

The partial U.S. map below shows the proportion of the population that was identified as enslaved in the 1860 census.  County by county, it reveals where the economy was most dominated by slavery.

1

A new paper by Avidit Acharya, Matthew Blackwell, and Maya Sen has discovered that the proportion of enslaved residents in 1860 — 153 years ago — predicts race-related beliefs today.   As the percent of the population in a county accounted for by the enslaved increases, there is a decreased likelihood that contemporary white residents will identify as a Democrat and support affirmative action, and an increased chance that they will express negative beliefs about black people.

Avidit and colleagues don’t stop there.  They try to figure out why.  They consider a range of possibilities, including contemporary demographics and the possibility of “racial threat” (the idea that high numbers of black people make whites uneasy), urban-rural differences, the destruction and disintegration caused by the Civil War, and more.  Controlling for all these things, the authors conclude that the results are still partly explained by a simple phenomenon: parents teaching their children.  The bias of Southern whites during slavery has been passed down intergenerationally.

Cross-posted at Pacific Standard.

Lisa Wade, PhD is an Associate Professor at Tulane University. She is the author of American Hookup, a book about college sexual culture; a textbook about gender; and a forthcoming introductory text: Terrible Magnificent Sociology. You can follow her on Twitter and Instagram.

Trayvon Martin
AP Images

In conversation, I keep accidentally referring to Zimmerman’s defense lawyers as “the prosecution.” Not surprising, because the defense of George Zimmerman was only a defense in the technical sense of the law. Substantively, it was a prosecution of Trayvon Martin. And in making the case that Martin was guilty in his own murder, Zimmerman’s lawyers had the burden of proof on their side, as the state had to prove beyond a reasonable doubt that Martin wasn’t a violent criminal.

This raises the question, who’s afraid of young black men? Zimmerman’s lawyers took the not-too-risky approach of assuming that white women are (the jury was six women, described by the New York Times as five white and one Latina).

“This is the person who … attacked George Zimmerman,” defense attorney Mark O’Mara said in his closing argument, holding up two pictures of Trayvon Martin, one of which showed him shirtless and looking down at the camera with a deadpan expression. He held that shirtless one up right in front of the jury for almost three minutes. “Nice kid, actually,” he said, with feigned sincerity.

Mark O'Mara
Joe Burbank/AP Images

Going into the trial, according to one analysis, the female jurors were supposed to have more negative views about Zimmerman’s vigilante behavior, and be more sympathetic over the loss of the child Trayvon. As a former prosecutor put it:

With the jury being all women, the defense may have a difficult time having the jurors truly understand their defense, that George Zimmerman was truly in fear for his life. Women are gentler than men by nature and don’t have the instinct to confront trouble head-on.

But was the jury’s race, or their gender, the issue? O’Mara’s approach suggests he thought it was the intersection of the two: White women could be convinced that a young black man was dangerous.

Race and Gender

Racial biases are well documented. With regard to crime, for example, one recent controlled experiment using a video game simulation found that white college students were most likely to accidentally fire at an unarmed suspect who was a black male — and most likely to mistakenly hold fire against armed white females. More abstractly, people generally overestimate the risk of criminal victimization they face, but whites are more likely to do so when they live in areas with more black residents.

The difference in racial attitudes between white men and women are limited. One analysis by prominent experts in racial attitudes concluded that “gender differences in racial attitudes are small, inconsistent, and limited mostly to attitudes on racial policy.” However, some researchers have found white men more prone than women to accept racist stereotypes about blacks, and the General Social Survey in 2002 found that white women were much more likely than men to describe their feelings toward African Americans positively. (In 2012, a minority of both white men and white women voted for Obama, although white men were more overwhelmingly in the Romney camp.)

What about juries? The evidence for racial bias over many studies is quite strong. For example, one 2012 study found that in two Florida counties having an all-white jury pool – that is, the people from which the jury will be chosen – increased the chance that a black defendant would be convicted. Since the jury pool is randomly selected from eligible citizens, unaltered by lawyers’ selections or disqualifications, the study has a clean test of the race effect. But I can’t find any on the combined influence of race and gender.

The classical way of framing the question is whether white women’s group identity as whites is strong enough to overcome their gender-socialized overall “niceness” when it comes to attitudes toward minority groups. But Zimmerman’s lawyers appeared to be invoking a very specific American story: white women’s fear of black male aggression. Of course the “victim” in their story was Zimmerman, but as he lingered over the shirtless photo, O’Mara was tempting the women on the jury to put themselves in Zimmerman’s fearful shoes.

Group Threat

But do white women really feel threatened by black men? That’s an old, blood-stained debate. In the 20th century there were 455 American men (legally) executed for rape, and 89 percent of them were black — most were accused of raping white women. That was just the legal tip of Jim Crow’s lynching iceberg, partly driven by white men asserting ownership over white women in the name of protection. But the image of course lives on.

In the specific realm of U.S. racial psychology, one of the less optimistic, but most reliable, findings is that whites who live in places with larger black populations on average express more racism (here’s a recent confirmation). Most analysts attribute that to some sense of group threat – economic, political, or violent – experienced by the dominant majority.

Because people inflate things they are afraid of, you can get a ballpark idea of how threatened white people feel by asking them how big they think the black population is. And since they don’t realize their racial attitudes are being measured, they aren’t as likely to shade their answers to appear reasonable.

The 2000 General Social Survey asked about 1,000 white adults to estimate the size of the black population. Both groups were way off, of course: 95 percent of white women and 85 percent of white men overestimated. But the skew was stronger for women than men: 69 percent of women and 49 percent of men guessed that blacks are more than 20 percent of the population (the correct answer at the time was 12 percent).

Here are those results, showing the cumulative percentage of white men and women who thought the black population was at or below each level:

1

Maybe white women’s greater overestimation of the black population is not an indicator of perceived threat. In the same survey white women were no more likely than white men to describe blacks as “prone to violence” (then again, there’s social pressure to say “no”).  Anyway, whether women feel more threatened than men do isn’t the issue, since the jury was all women. The question is whether the perceived threat was salient enough that the defense could manipulate it.

I don’t know what was in the hearts and minds of the jurors in this case, of course. Being on a jury is not like filling out a survey or playing a video game. But however much we elevate the rational elements in the system, emotion also plays a role. Whether they were right or not, Zimmerman’s lawyers clearly thought there was a vein of fear of black men inside the jurors’ psyches, waiting to be mined.

Originally posted at The Atlantic and Family Inequality.

Philip N. Cohen is a professor of sociology at the University of Maryland, College Park, and writes the blog Family Inequality. You can follow him on Twitter or Facebook.

Cross-posted at Family Inequality.

The other day I was surprised that a group of reporters failed to call out what seemed to be an obvious exaggeration by Republican Congresspeople in a press conference. Did the reporters not realize that a 25% unemployment rate among college graduates in 2013 is implausible, were they not paying attention, or do they just assume they’re being fed lies all the time so they don’t bother?

Last semester I launched an aggressive campaign to teach the undergraduate students in my class the size of the US population. If you don’t know that – and some large portion of them didn’t – how can you interpret statements such as, “On average, 24 people per minute are victims of rape, physical violence, or stalking by an intimate partner in the United States.” In this case the source followed up with, “Over the course of a year, that equals more than 12 million women and men.” But, is that a lot? It’s a lot more in the United States than it would be in China. (Unless you go with, “any rape is too many,” in which case why use a number at all?)

1

Anyway, just the US population isn’t enough. I decided to start a list of current demographic facts you need to know just to get through the day without being grossly misled or misinformed – or, in the case of journalists or teachers or social scientists, not to allow your audience to be grossly misled or misinformed. Not trivia that makes a point or statistics that are shocking, but the non-sensational information you need to know to make sense of those things when other people use them. And it’s really a ballpark requirement; when I tested the undergraduates, I gave them credit if they were within 20% of the US population – that’s anywhere between 250 million and 380 million!

I only got as far as 22 facts, but they should probably be somewhere in any top-100. And the silent reporters the other day made me realize I can’t let the perfect be the enemy of the good here. I’m open to suggestions for others (or other lists if they’re out there).

They refer to the US unless otherwise noted:

Description Number Source
World Population 7 billion 1
US Population 316 million 1
Children under 18 as share of pop. 24% 2
Adults 65+ as share of pop. 13% 2
Unemployment rate 7.6% 3
Unemployment rate range, 1970-2013 4% – 11% 4
Non-Hispanic Whites as share of pop. 63% 2
Blacks as share of pop. 13% 2
Hispanics as share of pop. 17% 2
Asians as share of pop. 5% 2
American Indians as share of pop. 1% 2
Immigrants as share of pop 13% 2
Adults with BA or higher 28% 2
Median household income $53,000 2
Most populous country, China 1.3 billion 5
2nd most populous country, India 1.2 billion 5
3rd most populous country, USA 315 million 5
4th most populous country, Indonesia 250 million 5
5th most populous country, Brazil 200 million 5
Male life expectancy at birth 76 6
Female life expectancy at birth 81 6
National life expectancy range 49 – 84 7

Sources:
1. http://www.census.gov/main/www/popclock.html
2. http://quickfacts.census.gov/qfd/states/00000.html
3. http://www.bls.gov/
4. Google public data: http://bit.ly/UVmeS3
5. https://www.cia.gov/library/publications/the-world-factbook/rankorder/2119rank.html
6. http://www.cdc.gov/nchs/hus/contents2011.htm#021
7. https://www.cia.gov/library/publications/the-world-factbook/rankorder/2102rank.html

Philip N. Cohen is a professor of sociology at the University of Maryland, College Park, and writes the blog Family Inequality. You can follow him on Twitter or Facebook.

Cross-posted at Family Inequality.

The other day when the Pew report on mothers who are breadwinners came out, I complained about calling wives “breadwinners” if they earn $1 more than their husbands:

A wife who earns $1 more than her husband for one year is not the “breadwinner” of the family. That’s not what made “traditional” men the breadwinners of their families — that image is of a long-term pattern in which the husband/father earns all or almost all of the money, which implies a more entrenched economic domination.

To elaborate a little, there are two issues here. One is empirical: today’s female breadwinners are much less economically dominant than the classical male breadwinner — and even than the contemporary male breadwinner, as I will show. And second, conceptually breadwinner not a majority-share concept determined by a fixed percentage of income, but an ideologically specific construction of family provision.

Let’s go back to the Pew data setup: heterogamously married couples with children under age 18 in the year 2011 (from Census data provided by IPUMS). In 23% of those couples the wife’s personal income is greater than her husband’s — that’s the big news, since it’s an increase from 4% half a century ago. This, to the Pew authors and media everywhere, makes her the “primary breadwinner,” or, in shortened form (as in their title), “breadwinner moms.” (That’s completely reasonable with single mothers, by the way; I’m just working on the married-couple side of the issue — just a short chasm away.)

The 50%+1 standard conceals that these male “breadwinners” are winning a greater share of the bread than are their female counterparts. Specifically, the average father-earning-more-than-his-wife earns 81% of the couple’s income; the average mother-earning-more-than-her-husband earns 69% of the couple’s income. Here is the distribution in more detail:

1

This shows that by far the most common situation for a female “breadwinner” is to be earning between 50% and 60% of the couple’s income — the case for 38% of such women. For the father “breadwinners,” though, the most common situation — for 28% of them — is to be earning all of the income, a situation that is three-times more common than the reverse.

Collapsing data into categories is essential for understanding the world. But putting these two groups into the same category and speaking as if they are equal is misleading.

This is especially problematic, I think, because of the historical connotation of the term breadwinner. The term dates back to 1821, says the Oxford English Dictionary. That’s from the heyday of America’s separate spheres ideology, which elevated to reverential status the woman-home/man-work ideal. Breadwinners in that Industrial Revolution era were not defined by earning 1% more than their wives. They earned all of the money, ideally (meaning, if their earnings were sufficient) but, just as importantly, they were the only one permanently working for pay outside the home. (JSTOR has references going back to the 1860s which confirm this usage.)

Modifying “breadwinner” with “primary” is better than not, but that subtlety has been completely lost in the media coverage. Consider these headlines from a Google news search just now:

Further down there are some references to “primary breadwinners,” but that’s rare.

Maybe we should call those 100%ers breadwinners, and call the ones closer to 50% breadsharers.

Philip N. Cohen is a professor of sociology at the University of Maryland, College Park, and writes the blog Family Inequality. You can follow him on Twitter or Facebook.