Search results for scientists

Over the last few weeks, commentary about alleged sexual predator Roy Moore’s failure to secure a seat in the U.S. Senate has flooded our news and social media feeds, shining a spotlight on the critical role of Black women in the election. About 98% of Black women, comprising 17% of total voters, cast their ballots for Moore’s opponent Doug Jones, ensuring Jones’s victory. At the same time, commentators questioned the role of White women in supporting Moore. Sources estimate that 63% of White women voted for Moore, including the majority of college-educated White women.

Vogue proclaimed, “Doug Jones Won, but White Women Lost.” U.S. News and World Reports asked, “Why do so many White women vote for misogynists?” Feminist blog Jezebel announced succinctly: “White women keep fucking us over.” Fair enough. But we have to ask, “What about Black and White men?” The fact that 48% of Alabama’s voting population is absent from these conversations is not accidental. It’s part of an incomplete narrative that focuses solely on the impact of women voters and continues the false narrative that fixing inequality is solely their burden.

Let’s focus first on Black men. Exit poll data indicate that 93% of Black men voted for Jones, and they accounted for 11% of the total vote. Bluntly put, Jones could not have secured his razor-thin victory without their votes. Yet, media commentary about their specific role in the election is typically obscured. Several articles note the general turnout of Black voters without explicitly highlighting the contribution of Black men. Other articles focus on the role of Black women exclusively. In a Newsweek article proclaiming Black women “Saved America,” Black men receive not a single mention. In addition to erasing a key contribution, this incomplete account of Jones’s victory masks concerns about minority voter suppression and the Democratic party taking Black votes for granted.

White men comprised 35% of total voters in this election, and 72% of them voted for Moore. But detailed commentary on their overwhelming support for Moore – a man who said that Muslims shouldn’t serve in Congress, that America was “great” during the time of slavery, and was accused of harassing and/or assaulting at least nine women in their teens while in his thirties – is frankly rare. The scant mentions in popular media may best be summed up as: “We expect nothing more from White men.”

As social scientists, we know that expectations matter. A large body of work indicates that negative stereotypes of Black boys and men are linked to deleterious outcomes in education, crime, and health. Within our academic communities we sagely nod our heads and agree we should change our expectations of Black boys and men to ensure better outcomes. But this logic of high expectations is rarely applied to White men. The work of Jackson Katz is an important exception. He, and a handful of others have, for years, pointed out that gender-blind conversations about violence perpetrated by men, primarily against women – in families, in romantic relationships, and on college campuses – serve only to perpetuate this violence by making its prevention a woman’s problem.

The parallels to politics in this case are too great to ignore. It’s not enough for the media to note that voting trends for the Alabama senate election were inherently racist and sexist. Pointing out that Black women were critically important in determining election outcomes, and that most White women continued to engage in the “patriarchal bargain” by voting for Moore is a good start, but not sufficient. Accurate coverage would offer thorough examinations of the responsibility of all key players – in this case the positive contributions of Black men, and the negative contributions of White men. Otherwise, coverage risks downplaying White men’s role in supporting public officials who are openly or covertly racist or sexist. This perpetuates a social structure that privileges White men above all others and then consistently fails to hold them responsible for their actions. We can, and must, do better.

Mairead Eastin Moloney is an Assistant Professor of Sociology at the University of Kentucky. 

Originally Posted at Discoveries

Many different factors go into deciding your college major — your school, your skills, and your social network can all influence what field of study you choose. This is an important decision, as social scientists have shown it has consequences well into the life course — not only do college majors vary widely in terms of earnings across the life course, but income gaps between fields are often larger than gaps between those with college degrees and those without them. Natasha Quadlin finds that this gap is in many ways due to differences in funding at the start of college that determine which majors students choose.

Photo by Tom Woodward, Flickr CC

Quadlin draws on data from the Postsecondary Transcript Study, a collection of over 700 college transcripts from students who were enrolled in postsecondary education in 2012. Focusing on students’ declared major during their freshman year, Quadlin analyzes the relationship between the source of funding a student gets — loans, grants, or family funds — and the type of major the student initially chooses — applied versus academic and STEM versus non-STEM. She finds that students who pay for college with loans are more likely to major in applied non-STEM fields, such as business and nursing, and they are less likely to be undeclared. However, students whose funding comes primarily from grants or family members are more likely to choose academic majors like sociology or English and STEM majors like biology or computer science.

In other words, low- and middle-income students with significant amounts of loan debt are likely to choose “practical” applied majors that more quickly result in full-time employment. Conversely, students with grants and financially supportive parents, regardless of class, are more likely to choose what are considered riskier academic and STEM tracks that are more challenging and take longer to turn into a job. Since middle- to upper-class students are more likely to get family assistance and merit-based grants, this means that less advantaged students are most likely to rely on loans. The problem, Quadlin explains, is that applied non-STEM majors have relatively high wages at first, but very little advancement over time, while academic and STEM majors have more barriers to completion but experience more frequent promotions. The result is that inequalities established at the start of college are often maintained throughout people’s lives.

Jacqui Frost is a PhD candidate in sociology at the University of Minnesota and the managing editor at The Society Pages. Her research interests include non-religion and religion, culture, and civic engagement.

Over at Family Inequality, Phil Cohen has a list of demographic facts you should know cold. They include basic figures like the US population (326 million), and how many Americans have a BA or higher (30%). These got me thinking—if we want to have smarter conversations and fight fake news, it is also helpful to know which way things are moving. “What’s Trending?” is a post series at Sociological Images with quick looks at what’s up, what’s down, and what sociologists have to say about it.

The Crime Drop

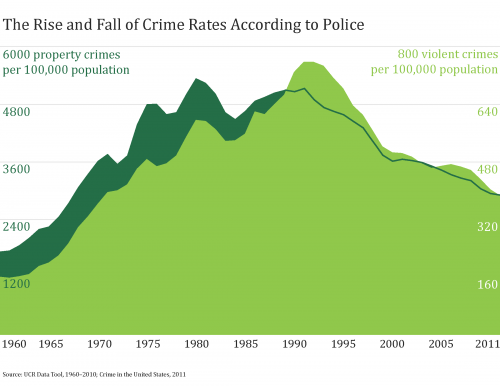
You may have heard about a recent spike in the murder rate across major U.S. cities last year. It was a key talking point for the Trump campaign on policing policy, but it also may be leveling off. Social scientists can also help put this bounce into context, because violent and property crimes in the U.S. have been going down for the past twenty years.

You can read more on the social sources of this drop in a feature post at The Society Pages. Neighborhood safety is a serious issue, but the data on crime rates doesn’t always support the drama.

Evan Stewart is an assistant professor of sociology at University of Massachusetts Boston. You can follow his work at his website, on Twitter, or on BlueSky.

Sexism in American society has been on the decline. Obstacles to female-bodied people excelling in previously male-only occupations and hobbies have lessened. And women have thrived in these spaces, sometimes even overtaking men both quantitatively and qualitatively.

Another kind of bias, though, has gotten worse: the preference for masculinity over femininity. Today we like our men manly, just like we used to, but we like our women just a little bit manly, too. This is true especially when women expect to compete with men in masculine arenas.

A recent study by a team of psychologists, led by Sarah Banchefsky, collected photographs of 40 male and 40 female scientists employed in STEM departments of US universities. 50 respondents were told they were participating in a study of “first impressions” and were asked to rate each person according to how masculine or feminine they appeared. They were not told their occupation. They were then asked to guess as to the likelihood that each person was a scientist, then the likelihood that each was an early childhood educator.

Overall, women were rated as more feminine than men and less likely to be scientists. Within the group of women, however, perceived femininity was also negatively correlated with the estimated likelihood of being a scientist and positively correlated with the likelihood of being an educator. In other words, both having a female body and appearing feminine was imagined to make a woman less inclined to or suited to science. The same results were not found for men.

5

Banchefsky and her colleagues conclude that “subtle variations in gendered appearance alter perceptions that a given woman is a scientist” and this has important implications for their careers:

First, naturally feminine-appearing young women and those who choose to emphasize their femininity may not be encouraged or given opportunities to become scientists as a result of adults’ beliefs that feminine women are not well-suited to the occupation.

Second, feminine-appearing women who are already scientists may not be taken as seriously as more masculine-appearing ones. They may have to overperform relative to their male and masculine female peers to be recognized as equally competent. Femininity may, then, cost them job opportunities, promotions, awards, grants, and valuable collaboration.

Lisa Wade, PhD is an Associate Professor at Tulane University. She is the author of American Hookup, a book about college sexual culture; a textbook about gender; and a forthcoming introductory text: Terrible Magnificent Sociology. You can follow her on Twitter and Instagram.

Facts about all manner of things have made headlines recently as the Trump administration continues to make statements, reports, and policies at odds with things we know to be true. Whether it’s about the size of his inauguration crowd, patently false and fear-mongering inaccuracies about transgender persons in bathrooms, rates of violent crime in the U.S., or anything else, lately it feels like the facts don’t seem to matter. The inaccuracies and misinformation continue despite the earnest attempts of so many to correct each falsehood after it is made.  It’s exhausting. But why is it happening?

Many of the inaccuracies seem like they ought to be easy enough to challenge as data simply don’t support the statements made. Consider the following charts documenting the violent crime rate and property crime rate in the U.S. over the last quarter century (measured by the Bureau of Justice Statistics). The overall trends are unmistakable: crime in the U.S. has been declining for a quarter of a century.

Now compare the crime rate with public perceptions of the crime rate collected by Gallup (below). While the crime rate is going down, the majority of the American public seems to think that crime has been getting worse every year. If crime is going down, why do so many people seem to feel that there is more crime today than there was a year ago?  It’s simply not true.

There is more than one reason this is happening. But, one reason I think the alternative facts industry has been so effective has to do with a concept social scientists call the “backfire effect.” As a rule, misinformed people do not change their minds once they have been presented with facts that challenge their beliefs. But, beyond simply not changing their minds when they should, research shows that they are likely to become more attached to their mistaken beliefs. The factual information “backfires.” When people don’t agree with you, research suggests that bringing in facts to support your case might actually make them believe you less. In other words, fighting the ill-informed with facts is like fighting a grease fire with water. It seems like it should work, but it’s actually going to make things worse.

To study this, Brendan Nyhan and Jason Reifler (2010) conducted a series of experiments. They had groups of participants read newspaper articles that included statements from politicians that supported some widespread piece of misinformation. Some of the participants read articles that included corrective information that immediately followed the inaccurate statement from the political figure, while others did not read articles containing corrective information at all.

Afterward, they were asked a series of questions about the article and their personal opinions about the issue. Nyhan and Reifler found that how people responded to the factual corrections in the articles they read varied systematically by how ideologically committed they already were to the beliefs that such facts supported. Among those who believed the popular misinformation in the first place, more information and actual facts challenging those beliefs did not cause a change of opinion—in fact, it often had the effect of strengthening those ideologically grounded beliefs.

It’s a sociological issue we ought to care about a great deal right now. How are we to correct misinformation if the very act of informing some people causes them to redouble their dedication to believing things that are not true?

Tristan Bridges, PhD is a professor at the University of California, Santa Barbara. He is the co-editor of Exploring Masculinities: Identity, Inequality, Inequality, and Change with C.J. Pascoe and studies gender and sexual identity and inequality. You can follow him on Twitter here. Tristan also blogs regularly at Inequality by (Interior) Design.

The 2017 Women’s March was a historic event.  Social media alone gave many of us the notion that something happened on an incredibly grand scale.  But measuring just how “grand” is an inexact science.  Women’s Marches were held around the world in protest of Trump on the day following his inauguration.  Subsequently, lots of folks have tried to find good ways of counting the crowds.  Photos and videos of the crowds at some of the largest marches are truly awe-inspiring.  And the media have gotten stirred up attempting to quantify just how big this march really was.

Think about it.  The image below is taken of some of the crowds in Los Angeles.  The caption Getty Images associates with the image includes the estimate “Hundreds of thousands of protesters…”  But, was it 200,000?  Or was it more like 900,000?  Do you think you could eyeball it and make an educated guess?  We’d bet you’d be off by more than you think.  Previous research has found, for instance, that march participants and organizers are not always the best source of information for how large a protest was.  If you’re there and you’re asked how many people were there, you’re much more likely to exaggerate the number of people who were actually there with you.  And that fact has spawned wildly variable estimates for marches around the U.S. and beyond.

More than one set of estimates exist attempting to figure this out.  The estimates that have garnered the most media attention (deservedly) are those produced by Jeremy Pressman and Erica Chenoweth.  They collected as many estimates as they could for marches all around the world to try to figure out just how large the protest was on a global scale.  Pressman & Chenoweth collected a range of estimates, and in their data set they classify them by source as well as providing the lowest and highest estimates for each of the marches for which they were able to collect data. You can see and interact with those estimates visually below in a map produced by Eric Compas (though some updates were made in the data set after Compas produced the map).

By Pressman & Chenoweth’s estimates, the total number of marchers in the U.S. was between 3,266,829 and 5,246,321 participants.  When they include marches outside the U.S. as well they found that we can add between 266,532 and 357,071 marchers to that number to understand the scale of the protest on an international scale.  That is truly extraordinary.  But, the range is still gigantic.  The difference between their lowest and highest estimate is around 2.1 million people!  Might it be possible to figure out which of these estimates are better estimates of crowd size than others?

Nate Silver at FiveThirtyEight.com tried to figure this out in an interesting way.  They only attempted to answer this question for U.S. marches alone.  And Silver and a collection of his statistical team produced their own data set of U.S. marches.  They collected as many crowd estimates as they could for all of the marches held in the U.S.  And there are lots of holes in their data that Pressman and Chenoweth filled.  March organizers collect information about crowd size and are eager to claim every individual who can be claimed to have been present.  But, local officials estimate crowd sizes as well because it helps to give them a sense of what they will need to prepare for and respond to such crowds.  As a part of this, some marches had estimates from march organizers, news sources, official estimates, as well as estimates from non-partisan experts (so-called crowd scientists)–this is especially true of the larger marches.  Examining their data, they discovered that for every march in which they had both organizer and official estimates, the organizers’ estimate was 50-70% higher than the officials’ estimates.  As Silver wrote: “Or put another way, the estimates produced by organizers probably exaggerated crowd sizes by 40 percent to 100 percent, depending on the city” (here).  The estimates Silver produced at FiveThirtyEight are mapped below.

You can interact with the map to see Nate Silver’s team estimate, but also the various estimates on which that estimate is based.  And you may note that the low and high estimates are often the same for Silver and for Pressman & Chenoweth (though not always).  Additionally, there were a good number of marches in FiveThirtyEight’s data set that lacked any estimates at all. And those marches are not visible on the map above.  Just to consider some of what is missing, you might note that there are no marches on the map immediately above in Puerto Rico, though Silver’s data set includes four marches there–all with no estimates.

Interestingly, Silver took a further step of offering a “best guess” based on patterned differences between types of estimates they found for marches for which they had more than a single source of data (more than one estimate).  For instance, where there were only organizers’ estimates, they discounted that estimate by 40%, assuming that it was exaggerated.  They discounted news estimates by 20% for similar reasons.  Sometimes, non-partisan experts relying on photographs and videos provide estimates were available, which were not discounted (similar to official estimates).

It might be possible then, as Pressman & Chenoweth collected many more estimates, to fine-tune Silver’s formula and possibly come up with an even more accurate estimate of crowd sizes at marches around the world based on the source of the estimate. It’s a fascinating puzzle and a really interesting and simple way of considering how to resolve it with a (likely) conservative measure.

By these (likely conservative) estimates, marches in the U.S. alone drew more than 3,000,000 people across hundreds of separate locations across the nation.  In the U.S. alone, FiveThirtyEight estimated that 3,234,343 people participated (though, as we said, some marches simply lacked any source of data in the data set they produced).  And that number, you might note, is strikingly close to Pressman & Chenoweth’s low estimate for the U.S. (3,266,829).  Even by this conservative estimate, this would qualify the 2017 Women’s March as certainly among the largest mass protests in U.S. history.  It may very well have been the largest mass protest in American history.  And in our book, that’s worth counting.

Tara Leigh Tober, PhD is a Lecturer in the Sociology Department at the University of California, Santa Barbara.  She studies the sociology of memory, is writing a book on how the Irish have remembered being neutral during WWII, and is presently engaged in a study on mass shootings in the U.S.  You can follow her on Twitter here.

Tristan Bridges, PhD is a professor at the University of California, Santa Barbara. He is the co-editor of Exploring Masculinities: Identity, Inequality, Inequality, and Change with C.J. Pascoe and studies gender and sexual identity and inequality. You can follow him on Twitter here. Tristan also blogs regularly at Inequality by (Interior) Design.

Originally posted at Made in America.

Explaining how such an unfit candidate and such a bizarre candidacy succeeded has become a critical concern for journalists and scholars. Through sites like Monkey Cage, Vox, and 538, as well as academic papers, we can watch political scientists in real time try to answer the question, “What the Hell Happened?” (There are already at least two catalogs of answers, here and here, and a couple of college-level Trump syllabi.) Although a substantial answer will not emerge for years, this post is my own morning-after answer to the “WTHH?” question.

I make three arguments: First, Trump’s electoral college victory was a fluke, a small accident with vast implications, but from a social science perspective not very interesting. Second, the deeper task is to understand who were the distinctive supporters for Trump, in particular to sort out whether their support was rooted mostly in economic or in cultural grievances; the evidence suggests cultural. Third, party polarization converted Trump’s small and unusual personal base of support into 46 percent of the popular vote.

Explaining November 8, 2016

Why did Donald Trump, an historically flawed candidate even to many of those who voted for him, win? With a small margin in three states (about 100,000 votes strategically located), many explanations are all true:

* Statistical fluke: Trump won 2.1 percentage points less of the popular vote than did Clinton, easily the largest negative margin of an incoming president in 140 years. (Bush was only 0.5 points behind Gore in 2000.) Given those numbers, Trump’s electoral college win was like getting two or three snake-eye dice rolls in a row. Similarly, political scientists’ structural models–which assume “generic” Democratic and Republican candidates and predict outcomes based on party incumbency and economic indicators–forecast a close Republican victory. “In 2012, the ‘fundamentals’ predicted a close election and the Democrats won narrowly,” wrote Larry Bartels. “In 2016, the ‘fundamentals’ predicted a close election and the Republicans won narrowly. That’s how coin tosses go.” But, of course, Donald Trump is far from a generic Republican. That’s what energizes the search for a special explanation.

* FBI Director Comey’s email announcement in the closing days of the election appeared to sway the undecided enough to easily make the 100,000 vote difference.

* Russian hacks plus Wikileaks.

* The Clinton campaign. Had she visited the Rust Belt more, embraced Black Lives Matter less (or more), or used a slogan that pointed to economics instead of diversity… who knows? Pundits have been mud-wrestling over whether her campaign was too much about identity politics or whether all politics is identity politics. Anyway, surely some tweak here would have made a difference.

* Facebook and Fakenews.

* The weather. It was seasonably mild with only light rain in the upper Midwest on November 8. Storms or snow would probably have depressed rural turnout enough to make Clinton president.

* The Founding Fathers. They meant the electoral college to quiet vox populi (and so it worked in John Q. Adams’s minus 10 point defeat of Andrew Jackson in 1824).

* Add almost anything you can imagine that could have moved less than one percent of the PA/MI/WI votes or of the national vote.

* Oh, and could Bernie would have won? Nah, no way, no how. [1]

Small causes can have enormous consequences: the precise flight of a bullet on November 22, 1963; missed intelligence notes about the suspicious student pilots before the 9/11 attacks; and so on. Donald Trump’s victory could become extremely consequential, second only to Lincoln’s in 1860, argues journalist James Fallows, [2] but the margin that created the victory was very small, effectively an accident. From an historical and social science point of view, there is nothing much interesting in Trump’s electoral college margin.

Trump’s Legions

More interesting is Trump’s energizing and mobilizing so many previously passive voters, notably during the primaries. What was that about?

One popular answer is that Trump’s base is composed of people, particularly members of the white working class (WWC), who are suffering economic dislocation. Because their suffering has not been addressed, they rallied to a jobs champion.

Another answer is that Trump’s core is composed of people, largely but not only WWC, with strong cultural resentments. While often suffering economically and voicing economic complaints, they are mainly distinguished by holding a connected set of racial, gender, anti-immigrant, and class resentments–resentments against those who presumably undermined America’s past “greatness,” resentments which tend to go together with tendencies toward authoritarianism (see this earlier post).

The empirical evidence so far best supports the second account. Indicators of cultural resentment better account for Trump support than do indicators of economic hardship or economic anxiety. [3]

In-depth, in-person reports have appeared that flesh out these resentments in ways that survey questions only roughly capture. They describe feelings of being pushed out of the way by those who are undeserving, by those who are not really Americans; feelings of being neglected and condescended to by over-educated coastal elites; feelings of seeing the America they nostalgically remember falling away. [4]

trump-supportersDefenders of the economic explanation would point to the economic strains and grievances of the WWC. Those difficulties and complaints are true–but they are not new. Less-educated workers have been left behind for decades now; the flat-lining of their incomes started in the 1970s, with a bit of a break in the late 1990s. Moreover, the economy has been in an upswing in the last few years; the unemployment rate was about 8 percent when Obama was re-elected in 2012, but about half of that when Trump was elected. Economic conditions do not explain 2016.

Nor are complaints about economic insecurity new. For example, the percentage of WWC respondents to the General Social Survey who said that they were dissatisfied with their financial situations has varied around 25 percent (+/- 5 points) over the last 30 years. The percentage dissatisfied did hit a high in the early years of the Great Recession (34 percent in 2010), but it dropped afterwards (to 31% in 2012 when Obama was re-elected and 29% in 2014). Economic discontent has been trending down, not up. [5] That only one-fifth of Trump voters supported raising the minimum wage to $15 further undercuts the primacy of economic motives.

To be sure, journalists can find and record the angry voices of economic distress; they do so virtually every election year. (Remember the painful stories about the foreclosure crisis and about lay-offs during the Great Recession?). There was little distinctive about either the economic distress or the economic anxiety of 2016 to explain Trump.

Some have noted, however, what appear to be a significant number of voters who supported Obama in 2008 or in 2012 and seemed to have switched to Trump in 2016 (e.g., here). Do these data not undermine a cultural, specifically a racial, explanation for Trump? No. In 2008, Obama received an unusual number of WWC votes because of the financial collapse, the Iraq fiasco, and Bush’s consequent unpopularity. These immediate factors overrode race for many in the WWC. But WWC votes for Obama dropped in 2012 despite his being the incumbent. Then, last November, the WWC vote for a Democratic candidate reverted back to its pre-Great Recession levels. [6] Put another way, Clinton’s support from the WWC was not especially low, Obama’s was unusually high for temporary reasons.

What was special about 2016 was the candidate: Donald Trump explicitly and loudly voiced the cultural resentments and authoritarian impulses of many in the WWC (and some in the middle class, too) that had been there for years but had had no full-throated champion–not Romney, not McCain, not the Bushes, probably not even Reagan–since perhaps Richard Nixon. What changed was not the terrain for a politics of resentment but the arrival of an unusual tiller of that soil, someone who brought out just enough of these voters to win his party’s nomination and to boost turnout in particular places for the general election. As one analyst wrote, “Trump repeatedly went where prior Republican presidential candidates were unwilling to go: making explicit appeals to racial resentment, religious intolerance, and white identity.”

But this is still less than half the story.

Party Polarization

To really how understand how Trump could get 46 percent of the vote, it takes more than identifying the distinctive sorts of people whom Trump attracted, because they are not that numerous. Trump won only a minority of the primary votes and faced intense opposition within his party. In the end, however, almost all Republicans came home to him–even evangelicals, to whose moral standards Trump is a living insult. The polarization of American politics in recent years was critical. Party ended up mattering more to college-educated, women, and suburban Republicans than whatever distaste they had for Trump the man.

Consider how historically new this development is. In 1964, the Republican nominee, Barry Goldwater, was considered to be at the far right end of the political spectrum. About 20 to 25% of Republicans crossed over and voted for Democrat Lyndon Johnson. (This crossover was mirrored by Democrats in the 1972 election. [7]) In 2016, by contrast, fewer than 10% of Republicans abandoned Trump–a far more problematic candidate than Goldwater–so much has America become polarized by party in the last couple of decades. [8]

Conclusions

Readings of the 2016 election as the product of a profound shift in American society or politics are overblown. In particular, notions that the WWC’s fortunes or views shifted so substantially in recent years as to account for Trump seem wrong.

What about the argument that the Trump phenomenon is part of a general rise across the western world of xenophobia? I don’t see much evidence outside of the Trump case itself for that in the United States. Long-term data suggest a decline–too slowly, for sure–rather than an increase in such attitudes.[9] And let’s not forget: Hillary Clinton won the popular vote.

The best explanation of why Trump got 46% of the ballots: Advantages for the out party in a third-term election + Trump’s unusual cultural appeal to a minority but still notable number of Americans + historically high party polarization. That Trump actually won the electoral college as well is pretty much an accident, albeit a hugely consequential one.


NOTES____________________

[1] Basically no one, including Trump, said anything bad about Bernie Sanders from the moment it became clear that Sanders would lose the primaries to Clinton. Had he been nominated, that silence would have ended fast and furiously. Moreover as the always astute Kevin Drum pointed out, Sanders is much too far to left to get elected, even way to the left of George McGovern, who got creamed in 1972. Finally, the “Bernie Brothers” who avoided Clinton would have been more than outnumbered by Hillary’s pissed-off sisters if she had been once again displaced by a man.

[2] On the other hand, economist-blogger Tyler Cowen is skeptical: If the doomsayers are right, why aren’t investors dumping equities, shorting the market, or fleeing to safer commodities?

[3] See these sources: 1, 2, 3, 4, 5, 6.

[4] For examples: 1, 2, 34.

[5] My analysis of the GSS through 2014. White working class is defined as whites who have not graduated college.

[6] Again, I used the GSS. In 2000 and 2004, the Democratic candidates, Gore and Kerry, got about 35 percent of the WWC vote, about what Bill Clinton got in his first run in 1992. Obama got substantially more, 48%, in 2008, then somewhat less, 42%, in 2012. Hillary Clinton got, according to a very different sort of survey, the exit polls, 29% of the WWC, but it is hard to compare the two methods. Note that the GSS reports of who people voted for in the previous election tend to skew toward the winners, but the point still stands that Obama’s jump in support from the WWC, especially in 2008, was quite unusual, not Hillary Clinton’s apparent slump in support.

[7] According to Gallup’s last poll before the 1964 election, 20% of Republicans were going to vote for Johnson. According to my analysis of the American National Election Survey, which is retrospective, 26% actually did. In 1972, the Democrats nominated the most left-leaning candidate of postwar era. According to Gallup data, 33% of Democrats crossed over to vote for Nixon. ANES data suggest that about 40 percent did. Whatever the specifics, there was much more cross-over voting 40 to 50 years ago, even under milder provocation.

[8] On the decline of ticket-splitting, see here.

[9] For example, one of the longest-running items in the GSS is the question, “I’d like you to tell me whether you think we’re spending too much money … too little money, or about the right amount … improving the conditions of Blacks.” In the 1970s, 28% of whites said too much; in the 2000s, 19% did. Another question was asked only through 2002: “Do you agree or disagree… (Negroes/blacks/African-Americans) shouldn’t push themselves where they’re not wanted?” In the 1970s, 74% of whites agreed; from 1990 to 2002, 15% did. More striking, in the 1970s, 11% of whites “strongly disagreed”; from 1990 to 2002, 32% did. On immigrants: David Weakliem has graphed responses to a recurrent Gallup Poll question, “Should immigration be kept at its present level, increased or decreased?”. From 1965 to the mid-1990s, the trend was strongly toward “decreased,” but since then the trend has strongly been toward “increased” (although that’s still a minority view).

Claude S. Fischer, PhD is a sociologist at UC Berkeley and is the author of Made in America: A Social History of American Culture and Character. This post originally appeared at his blog, Made in America.

1Botox has forever transformed the primordial battleground against aging. Since the FDA approved it for cosmetic use in 2002, eleven million Americans have used it. Over 90 percent of them are women.

In my forthcoming book, Botox Nation, I argue that one of the reasons Botox is so appealing to women is because the wrinkles that Botox is designed to “fix,” those disconcerting creases between our brows, are precisely those lines that we use to express negative emotions: angry, bitchy, irritated.  Botox is injected into the corrugator supercilii muscles, the facial muscles that allow us to pull our eyebrows together and push them down.  By paralyzing these muscles, Botox prevents this brow-lowering action, and in so doing, inhibits our ability to scowl, an expression we use to project to the world that we are aggravated or pissed off.

9781479825264_Full.jpg (200×300)

Sociologists have long speculated about the meaning of human faces for social interaction. In the 1950s, Erving Goffman developed the concept of facework to refer to the ways that human faces act as a template to invoke, process, and manage emotions. A core feature of our physical identity, our faces provide expressive information about our selves and how we want our identities to be perceived by others.

Given that our faces are mediums for processing and negotiating social interaction, it makes sense that Botox’s effect on facial expression would be particularly enticing to women, who from early childhood are taught to project cheerfulness and to disguise unhappiness. Male politicians and CEOs, for example, are expected to look pissed off, stern, and annoyed. However, when Hillary Clinton displays these same expressions, she is chastised for being unladylike, as undeserving of the male gaze, and criticized for disrupting the normative gender order. Women more so than men are penalized for looking speculative, judgmental, angry, or cross.

Nothing demonstrates this more than the recent viral pop-cultural idioms “resting bitch face.” For those unfamiliar with the not so subtly sexist phrase, “resting bitch face,” according to the popular site Urban Dictionary, is “a person, usually a girl, who naturally looks mean when her face is expressionless, without meaning to.” This same site defines its etymological predecessor, “bitchy resting face,” as “a bitchy alternative to the usual blank look most people have. This is a condition affecting the facial muscles, suffered by millions of women worldwide. People suffering from bitchy resting face (BRF) have the tendency look hostile and/or judgmental at rest.”

Resting bitch face and its linguistic cousin is nowhere near gender neutral. There is no name for men’s serious, pensive, and reserved expressions because we allow men these feelings. When a man looks severe, serious, or grumpy, we assume it is for good reason. But women are always expected to be smiling, aesthetically pleasing, and compliant. To do otherwise would be to fail to subordinate our own emotions to those of others, and this would upset the gendered status quo.

This is what the sociologist Arlie Russell Hochschild calls “emotion labor,” a type of impression management, which involves manipulating one’s feelings to transmit a certain impression. In her now-classic study on flight attendants, Hochschild documented how part of the occupational script was for flight attendants to create and maintain the façade of positive appearance, revealing the highly gendered ways we police social performance. The facework involved in projecting cheerfulness and always smiling requires energy and, as any woman is well aware, can become exhausting. Hochschild recognized this and saw emotion work as a form of exploitation that could lead to psychological distress. She also predicted that showing dissimilar emotions from those genuinely felt would lead to the alienation from one’s feelings.

Enter Botox—a product that can seemingly liberate the face from its resting bitch state, producing a flattening of affect where the act of appearing introspective, inquisitive, perplexed, contemplative, or pissed off can be effaced and prevented from leaving a lasting impression. One reason Botox may be especially appealing to women is that it can potentially relieve them from having to work so hard to police their expressions.

Even more insidiously, Botox may actually change how women feel. Scientists have long suggested that facial expressions, like frowning or smiling, can influence emotion by contributing to a range of bodily changes that in turn produce subjective feelings. This theory, known in psychology as the “facial feedback hypothesis,” proposes that expression intensifies emotion, whereas suppression softens it. It follows that blocking negative expressions with Botox injections should offer some protection against negative feelings. A study confirmed the hypothesis.

Taken together, this works point to some of the principal attractions of Botox for women. Functioning as an emotional lobotomy of sorts, Botox can emancipate women from having to vigilantly police their facial expressions and actually reduce the negative feelings that produce them, all while simultaneously offsetting the psychological distress of alienation.

Dana Berkowitz is a professor of sociology at Louisiana State University in Baton Rogue where she teaches about gender, sexuality, families, and qualitative methods. Her book, Botox Nation: Changing the Face of America, will be out in January and can be pre-ordered now.