A different version of this post was originally published at Timeline.
To get some perspective on the long term trend in divorce, we need to check some common assumptions. Most importantly, we have to shake the idea that the trend is just moving in one direction, tracking a predictable course from “olden days” to “nowadays.”
It’s so common to think of society developing in on direction over time that people rarely realize they are doing it. Regardless of political persuasion, people tend to collapse history into then versus now whether they’re using specific dates and facts or just imagining the sweep of history.
In reality, sometimes it’s true and sometimes it’s not true that society has a direction of change over a long time period. Some social trends are pretty clear, such as population growth, longevity, wealth, or the expansion of education. But when you look more closely, and narrow the focus to the last century or so, it turns out that even the trends that are following some path of progress aren’t moving linearly, and the fluctuations can be the big story.
Demography provides many such examples. For example, although it’s certainly true that Americans have fewer children now than they did a century ago, the Baby Boom – that huge spike in birth rates from 1946 to 1964 – was such a massive disruption that in some ways it is the big story of the century. Divorce is another.
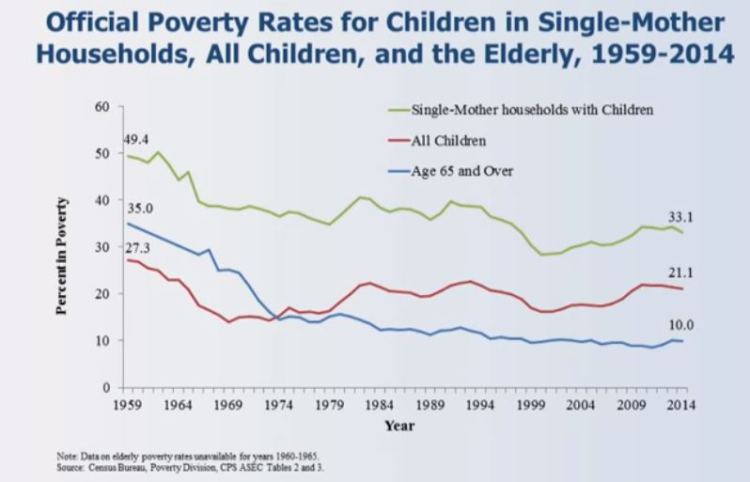
The most popular false assumption about divorce – sort of like crime or child abuse – is that it’s always getting worse (which isn’t true of crime or child abuse, either). In the broadest sense, yes, there is more divorce nowadays than there was in the olden days, but the trend is complicated and has probably reversed.
It turns out, however, that the story of divorce rates is ridiculously complicated. For one thing, there is no central data source that simply counts all divorces. The National Center for Health Statistics used to divorces from states, but now six states don’t feel like cooperating anymore, including, unbelievably, California. Even where divorces are counted, key information may not be available, such as the people’s age or how long they were married (or, now that there is gay divorce, their genders). Fortunately, the Census Bureau (for now) does a giant sample survey, the American Community Survey, which gives us great data on divorce patterns, but they only started collecting that information in 2008.
The way demographers ask the question is also different from what the public wants to know. The typical concerned citizen (or honeymooner) wants to know: what are the odds that I (or someone else getting married today) will end up divorced? Science can guess, but it’s impossible to give a definitive answer, because we can’t actually predict human behavior. Still, we can help.
The short answer is that divorce is more common than it was a 75 years ago, but less common than it was at the peak in 1979. Here’s the trend in what we call the “refined” divorce rate – the number of divorces each year for every thousand married women in the country:
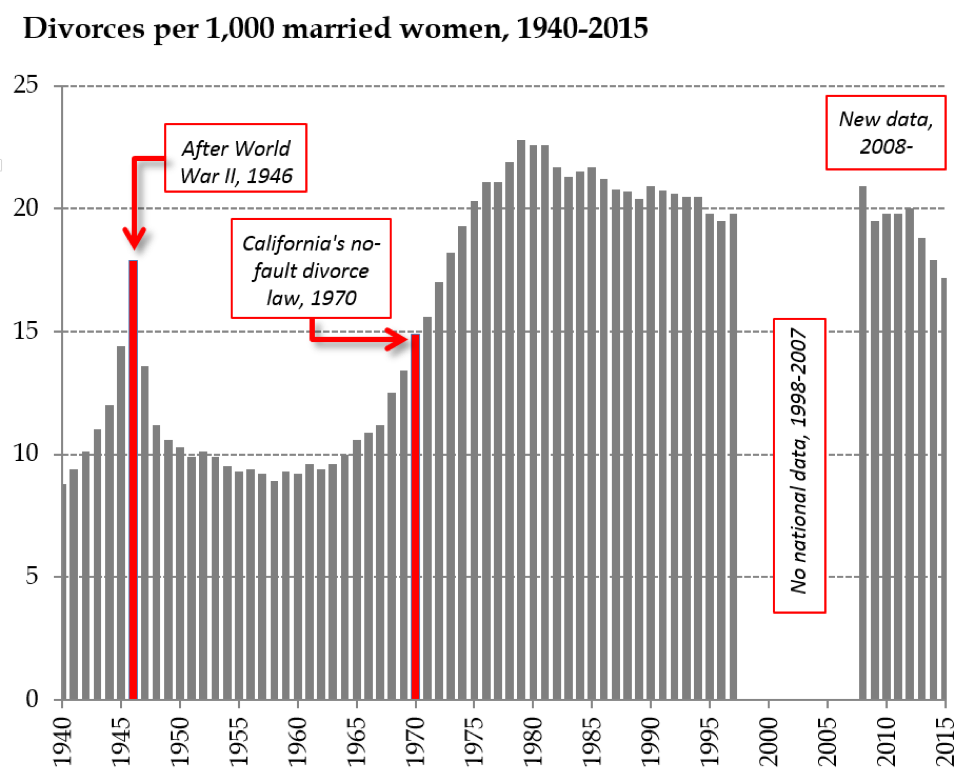
The figure uses the federal tally from states from 1940 to 1997, leaves out the period when there was no national collection, and then picks up again when the American Community Survey started asking about divorce.
So the long term upward trend is complicated by a huge spike from soldiers returning home at the end of World War II (a divorce boom, to go with the Baby Boom), a steep increase in the sixties and seventies, and then a downward glide to the present.
How is it possible that divorce has been declining for more than three decades? Part of it is a function of the aging population. As demographers Sheela Kennedy and Steven Ruggles have argued, old people divorce less, and the married population is older now than it was in 1979, because the giant Baby Boom is now mostly in its sixties and people are getting married at older ages. This is tricky, though, because although older people still divorce less, the divorce rates for older people (50+) have doubled in the last two decades. Baby Boomers especially like to get divorced and remarried once their kids are out of the house.
But there is a real divorce decline, too, and this is promising about the future, because it’s concentrated among young people – their chances of divorcing have fallen over the last decade. So, although in my own research I’ve estimated that estimated that 53% of couples marrying today will get divorced, that is probably skewed by all the older people still pulling up the rates. Typical Americans getting married in their late 20s today probably have a less than even chance of getting divorced. The divorce will probably keep falling.
Rather than a conservative turn toward family values, I think this represents an improving quality of marriages. When marriage is voluntary – when people really choose to get married instead of simply marching into it under pressure to conform – one hopes they would be making better choices, and the data support that. Further, as marriage has become more rare, it has also become more select. Despite more than a decade of futile marriage promotion efforts by the federal government, marriage is still moving up the income scale. The people getting married today are more privileged than they used to be: more highly educated (both partners), and more stably situated. All that bodes well for the survival of their marriages, but doesn’t help the people left out of the institution. If less divorce just means only perfect couples are getting married, that’s merely another indicator of rising inequality.
Putting this trend back in that long term context, we should also ask whether falling divorce rates – which run counter to the common assumption that everything modern in family life is about the destruction of the nuclear family – are always a good thing. Most people getting married would like to think they’ll stay together for the long haul. But what is the right amount of divorce for a society to have? It seems like an odd question, but divorce really isn’t like crime or child abuse. You want some divorces, because otherwise it means people are stuck in bad marriages. If you have no divorce that means even abusive marriages can’t break up. If you have a moderate amount, it means pretty bad marriages can break up but people don’t treat it lightly. And if you have tons of divorce it means people are just dropping each other willy-nilly. When you put it that way, moderate sounds best. No one has been able to put numbers to those levels, but it’s still good to ask. Even as we shouldn’t assume families are always falling apart more than they used to, we should consider the pros and cons of divorce, rather than insisting more is always worse.
Philip N. Cohen is a professor of sociology at the University of Maryland, College Park. He writes the blog Family Inequality and is the author of The Family: Diversity, Inequality, and Social Change. You can follow him on Twitter or Facebook.

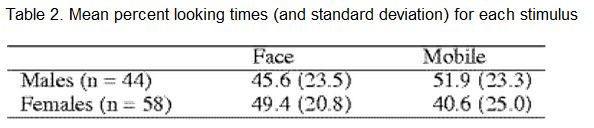 They didn’t report the whole distribution of boys’ and girls’ gaze-times, but it’s obvious that there is a huge overlap in the distributions, despite a difference in the means. In the mobile-gaze-time, for example, the difference in averages is 9.7 seconds, while the standard deviations are more than 20 seconds. If I turn to my handy normal curve spreadsheet template, and fit it with these numbers, you can see what the pattern might look like (I truncate these at 0 seconds and 70 seconds, as they did in the study):
 Source: My simulation assuming normal distributions from the data in the table above.