Search results for scientists

Flashback Friday.

Eden H. sent in an exploratory study about kids’ stereotypes of scientists. The U.S. Department of Energy’s Fermilab asked 7th graders to draw and describe a “scientist” before and after visiting the lab on a class trip. They first read about the Fermilab, then came to the lab and meet with some of the scientists and talk about their work. From the Fermilab website:

What we changed for this field trip was the before and after descriptions and small group sessions for each student to meet with two of three physicists rather than one large group session. We deliberately chose a typical white male, a young female and an African American physicist. We let the students and physicist take their discussion where they wanted.

Here are some of the before-and-after pictures and descriptions (all 31 are available here):

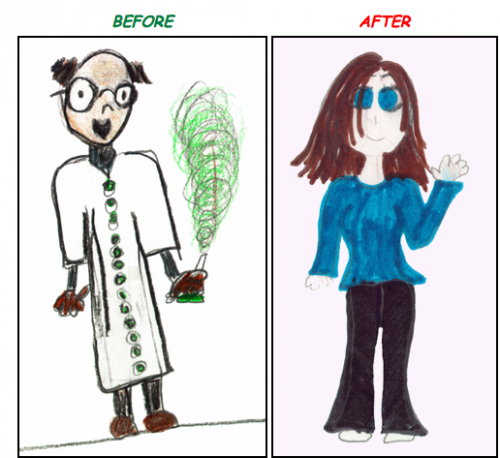
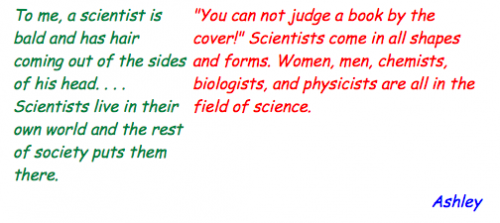
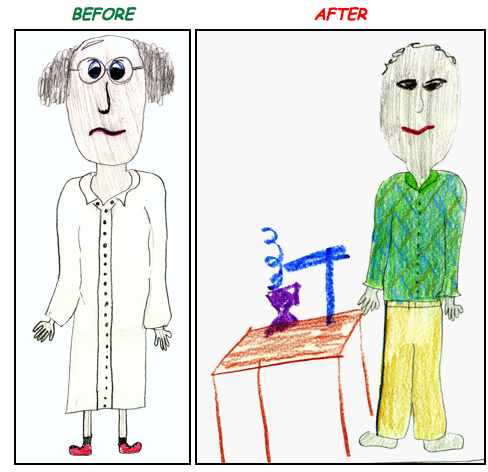
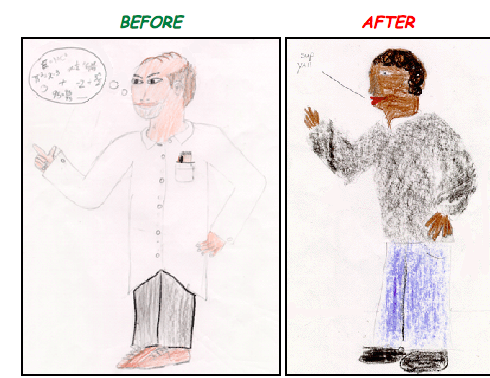
In general, the students seemed to come away with an idea of scientists as being more like “normal” people, not just stereotypical geeks in lab coats. But some of the other changes are interesting, too. The author of a post about the study at Restructure! analyzed the before-and-after images (as best as she could identify the sex of the drawings):

  • Among girls (14 in total), 36% portrayed a female scientist in the “before” drawing, and 57% portrayed a female scientist in the “after” drawing.
  • Among boys (17 in total), 100% portrayed a male scientist in the “before” drawing, and 100% portrayed a male scientist in the “after” drawing.

I looked through all of them and only saw one instance (posted above) where the child changed the scientists to be clearly non-White.

Of course this is a small sample, but the results seem to reproduce what other studies have found regarding the importance of role models and gender stereotyping, in particular, that girls are more likely to imagine themselves  in careers when they see women doing them. For instance, the relative lack of female professors in male-dominated departments such as engineering may play a role in discouraging women from choosing to major in such fields (as well as other factors such as steering, concerns about family/work conflicts, etc.).

Originally posted in 2010.

Gwen Sharp, PhD is a professor of sociology and the Associate Dean of liberal arts and sciences at Nevada State College. 

A new survey of 557 female scientists found widespread experiences of discrimination and alienation in the workforce that varied in interesting ways by race.7

While all types of women reported experiencing these forms of discrimination in large numbers — and 100% of a sub-sample of 60 interviewed for the study reported at least one — the race differences are interesting:

  • Black women were especially likely to need to prove and re-prove competence.
  • Asian and white women, especially, received pressure to withdraw from the workplace after having children.
  • Asian women were most likely to be pushed to perform a stereotypically feminine role in the office, followed by white and then Latina women. Black women rarely reported this.
  • Latina and white women were most likely to feel supported by other women in the workforce; Black women the least.
  • And almost half of Black and Latina women had been mistaken for janitors or administrative assistants, compared to a third of white women and a quarter of Asian women.

The study, by law professor Joan Williams and two colleagues, can be found here.

Lisa Wade, PhD is an Associate Professor at Tulane University. She is the author of American Hookup, a book about college sexual culture; a textbook about gender; and a forthcoming introductory text: Terrible Magnificent Sociology. You can follow her on Twitter and Instagram.

For the last week of December, we’re re-posting some of our favorite posts from 2012. Originally cross-posted at Ms.

Larry H., Shayna A.-S., and Laura F. sent in a recently released study, “Science Faculty’s Subtle Gender Biases Favor Male Students,” that shows compelling evidence for unconscious gender bias among faculty, specifically in some natural and biological science fields. The researchers asked a national sample of 127 biology, physics, and chemistry professors to evaluate the application materials of an undergrad science student who applied for a lab manager position, a job they saw as a gateway to other opportunities. Everyone was given the same materials (excerpts here), but half the applicants were given the first name Jennifer and half were called John. The participants were told the student would be given feedback based on their evaluations.

The results are sobering. There was a significant difference in the average competence, hireability, and mentoring ratings by gender. Professors who thought they were evaluating a female applicant saw a less qualified candidate than professors who were evaluating the identical application materials but thought it was from a man:

So not only was there a gap in perceived competence and fit for the position, but professors were less willing to engage in the type of mentoring that can help students gain both skills and confidence in their abilities — which can be especially important for under-represented groups.

And despite what you might expect, female professors were just as likely to do this as male professors were. Just thinking an applicant was female seems to have touched off an unconscious bias that led them to see female candidates negatively and to be less willing to spend time mentoring them. Professors’ age, tenure status, and discipline didn’t make a difference, either.

The professors were also asked to recommend a starting salary. Again, there was a significant difference. The average suggested beginning salary for the male candidate was $30,238, while for the female student it was $26,507:

The authors point out that these findings are especially noteworthy because, unlike many studies of gender bias that use college students or people who have never had to make the type of hiring or mentoring decisions they’re being asked to engage in for the study, this sample was made up of scientists who are active in their fields, regularly working with students.

Interestingly, when asked how much they liked the candidate, those evaluating the female student gave a higher score than those assigned the male student. But this didn’t translate into seeing the female candidate as competent. The study authors argue that this is strong evidence for subtle gender bias. The professors didn’t express dislike or hostility toward a female candidate. In fact, they tended to actively like her. But as the researchers explained,

…despite expressing warmth toward emerging female scientists, faculty members of both genders appear to be affected by enduring cultural stereotypes about women’s lack of science competence that translate into biases in student evaluation and mentoring. (p. 4)

This study implies that women in the natural and biological sciences (and yes, surely other fields too) still face prejudices that can impact the opportunities they are given to work closely with professors to gain important experiences and skills, as well as limiting their access to jobs and starting them out at a lower salary. These factors can snowball over time, creating larger and larger gaps in career achievements and income as men capitalize on opportunities while women find it impossible to catch up.

Gwen Sharp is an associate professor of sociology at Nevada State College. You can follow her on Twitter at @gwensharpnv.

Since mid-March 2020, Gallup has been polling Americans about their degree of self-isolation during the pandemic. The percent who said they had “avoided small gatherings” rose from 50% in early-March to 81% in early April, dropping slightly to 75% in late April as pressures began rising to start loosening stay-at-home orders.

What makes this curve sociologically interesting is our leaders generally made the restrictions largely voluntary, hoping for social norms to do the job of control. Only a few state and local governments have issued citations for holding social gatherings. Mostly, social norms have been doing the job. But increasingly the partisan divide on self-isolation is widening and undermining pandemic precautions. The chart, which appeared in a Gallup report on May 11, 2020, vividly shows the partisan divide on beliefs in distancing as protection from the pandemic. The striking finding is the huge partisan gap with independents leaning slightly toward Democrats.  

Not only did the partisan divide remain wide, but the number of adults practicing “social distancing” dropped from 75% in early April to 58%. This drop in so called self-reported “social distancing” occurred in states both with and without stay-at-home orders. Elsewhere I argue that “social distancing” is a most unfortunate label for physical distancing.

Republicans have been advocating for opening up businesses early, but it is not a mere intellectual debate. Some held large protests while brandishing firearms; others appeared in public without masks and without observing 6-feet distances. Some business that re-opened in early May reported customers acting disrespectful to others, ignoring the store’s distancing rules. In another incident, an armed militia stood outside a barbershop to keep authorities from closing down the newly reopened shop.

Retail operations in particular are concerned about compliance
to social norms because without adequate compliance, other customers will not
return. Social norms rely on social trust. If retail operations cannot depend
upon customers to be respectful, they will not only lose additional customers
but employees as well.

The Sad Impact of Pandemic Partisanship    

American society was highly partisan before the pandemic, so it is not surprising that partisan signs remain. For a few weeks in March and April, partisanship took a back seat and signs of cooperation suggested societal solidarity.

We are only months away from the Presidential election, so we do not expect either side to let us forget the contest. However, we can only hope that partisans will not forget that politics cannot resolve the pandemic alone. Without relying heavily on scientists and health system experts, our society can only fail.

Unfortunately, lives hang in the balance if there is a partisan failure to reach consensus on distancing and related precautions. Economists at Stanford and Harvard, using distancing data from smartphones as well as local data on COVID cases and deaths, completed a sophisticated model of the first few months of the pandemic. Their report, “Polarization and Public Health: Partisan Differences in Social Distancing during the Coronavirus Pandemic,” found that (1) Republicans engage in less social distancing, and (2) if this partisanship difference continues, the US will end up with more COVIC-19 transmission at a higher economic cost. Assuming the researchers’ analytical model is accurate, the Republican ridicule of social distancing is such an ironic tragedy. Not only will lives be lost but what is done under the banner of promoting economic benefit, is actually producing greater economic hardship.

Ron Anderson, Professor Emeritus, University of Minnesota, taught sociology from 1968 to 2005. His early work centered around the social diffusion of technology. Since 2005, his work has focused on compassion and the social dimensions of suffering.

Tis’ the season for throwing down at dinner. Every year the humor and the horror stories about Thanksgiving hit our social media feeds. This isn’t just about politics, either. Family dinners have a strong symbolic significance. When the stakes are high for a once-a-year gathering, other kinds of social conflicts are primed to play out as well.

Photo Credit: Louish Pixel, Flickr CC

But for all this talk about fighting, one thing I find really interesting as a political sociologist is just how much work people do to avoid conflict. We know from embedded studies of parent organizations and neighborhood groups that people will tie themselves up in knots to avoid talking about political issues. In some cases, people are more likely to confide in near-strangers or acquaintances than close family members. In an increasingly fraught political climate, the answer for many people might be cutting their visits short. According to research published last year Science, there is some evidence for this happening.

In the article, political scientists matched anonymous smartphone location data from over 10 million Americans to precinct-level voting data from 2016. By doing this, they could see who traveled for Thanksgiving that year and how long they stayed at dinner. People who ate in an opposing political district spent less time at dinner, about 30-50 minutes less on average. The pattern was stronger for people coming from Republican districts to dine among Democrats—they split about 50 to 70 minutes sooner. The authors also find that increased local political advertising was also associated with cut-down dinner time.

Sure, these people could be storming out before that second helping. But I think one of the less-appreciated trends in political life is that many of us are just clamming up and cutting out early to spend time elsewhere. There are many perfectly valid reasons to do this, especially if people are made to feel unwelcome or unsafe. These results suggest we could all do a little more to think about keeping people at the table.

Evan Stewart is an assistant professor of sociology at University of Massachusetts Boston. You can follow his work at his website, on Twitter, or on BlueSky.

Social scientists rely on the normal distribution all the time. This classic “bell curve” shape is so important because it fits all kinds of patterns in human behavior, from measures of public opinion to scores on standardized tests.

But it can be difficult to teach the normal distribution in social statistics, because at the core it is a theory about patterns we see in the data. If you’re interested in studying people in their social worlds, it can be more helpful to see how the bell curve emerges from real world examples.

One of the best ways to illustrate this is the “Galton Board,” a desk toy that lets you watch the normal distribution emerge from a random drop of ball-bearings. Check out the video below or a slow motion gif here.

The Galton Board is cool, but I’m also always on the lookout for normal distributions “in the wild.” There are places where you can see the distribution in real patterns of social behavior, rather than simulating them in a controlled environment. My absolute favorite example comes from Ed Burmila:

The wear patterns here show exactly what we would expect a normal distribution to tell us about weightlifting. More people use the machine at a middle weight setting for the average strength, and the extreme choices are less common. Not all social behavior follows this pattern, but when we find cases that do, our techniques to analyze that behavior are fairly simple.

Another cool example is grocery shelves. Because stores like to keep popular products together and right in front of your face (the maxim is “eye level is buy level“), they tend to stock in a normally-distributed pattern with popular stuff right in the middle. We don’t necessarily see this in action until there is a big sale or a rush in an emergency. When stores can’t restock in time, you can see a kind of bell curve emerge on the empty shelves. Products that are high up or off to the side are a little less likely to be picked over.

Paul Swansen, Flickr CC

Have you seen normal distributions out in the wild? Send them my way and I might feature them in a future post!

Evan Stewart is an assistant professor of sociology at University of Massachusetts Boston. You can follow his work at his website, on Twitter, or on BlueSky.

What do college graduates do with a sociology major? We just got an updated look from Phil Cohen this week:

These are all great career fields for our students, but as I was reading the list I realized there is a huge industry missing: data science and analytics. From Netflix to national policy, many interesting and lucrative jobs today are focused on properly observing, understanding, and trying to predict human behavior. With more sociology graduate programs training their students in computational social science, there is a big opportunity to bring those skills to teaching undergraduates as well.

Of course, data science has its challenges. Social scientists have observed that the booming field has some big problems with bias and inequality, but this is sociology’s bread and butter! When we talk about these issues, we usually go straight to very important conversations about equity, inclusion, and justice, and rightfully so; it is easy to design algorithms that seem like they make better decisions, but really just develop their own biases from watching us.

We can also tackle these questions by talking about research methods–another place where sociologists shine! We spend a lot of time thinking about whether our methods for observing people are valid and reliable. Are we just watching talk, or action? Do people change when researchers watch them? Once we get good measures and a strong analytic approach, can we do a better job explaining how and why bias happens to prevent it in the future?

Sociologists are well-positioned to help make sense of big questions in data science, and the field needs them. According to a recent industry report, only 5% of data scientists come out of the social sciences! While other areas of study may provide more of the technical skills to work in analytics, there is only so much that the technology can do before companies and research centers need to start making sense of social behavior. 

Source: Burtch Works Executive Recruiting. 2018. “Salaries of Data Scientists.” Emphasis Mine

So, if students or parents start up the refrain of “what can you do with a sociology major” this fall, consider showing them the social side of data science!

Evan Stewart is an assistant professor of sociology at University of Massachusetts Boston. You can follow his work at his website, on Twitter, or on BlueSky.

Housing is a serious issue across the country, and here in Minneapolis there has been a big discussion about new zoning policies that could be a model for cities everywhere. 

In true midwestern fashion, the favored way to fight this out on the ground is the passive-aggressive yard sign. Homeowners kicked it off, followed by a pro-development crowd seeking more affordable housing.

Regardless of where you stand on the issue, both groups draw grassroots support from local residents who live in Minneapolis and have a stake in how it might change. Just recently, though, someone else jumped on the bandwagon. A new set of shiny yard signs started popping up all over my neighborhood. Someone had coordinated an overnight drop, putting out three or more signs every block with this slogan:

Many of the signs were outside apartment buildings, and it turns out that they came from a group of landlords organizing against protections for renters. I came home to my apartment one day to find three signs posted in the front yard of the building. Nobody told us these signs were going up, and many of them were removed the following week.

This is a classic example of what social scientists call “astroturfing”—a practice where business leaders copy grassroots activism strategies to advocate for their political interests. According to sociologist Edward Walker, full-on astroturfing where a business relies on deception to suggest grassroots support is pretty rare. This is a risky practice that can backfire if they get caught. Instead, business are getting much more savvy by adopting other kinds of grassroots organizing tactics to drive attention to their interests.

These signs show the power of astroturfing, because we usually assume a lawn sign is a pretty direct statement—one that represents the person who lives behind it. Sure, landlords can lobby just like everyone else, but do they have a right to do it in front of where their tenants live, especially if they might disagree? A counter-mobilization effort is already underway in the neighborhood.

Evan Stewart is an assistant professor of sociology at University of Massachusetts Boston. You can follow his work at his website, on Twitter, or on BlueSky.